Liberian Self-Care Disability
COMPARE
Liberian
Select to Compare
Self-Care Disability
Liberian Self-Care Disability
2.6%
SELF-CARE DISABILITY
2.1/ 100
METRIC RATING
233rd/ 347
METRIC RANK
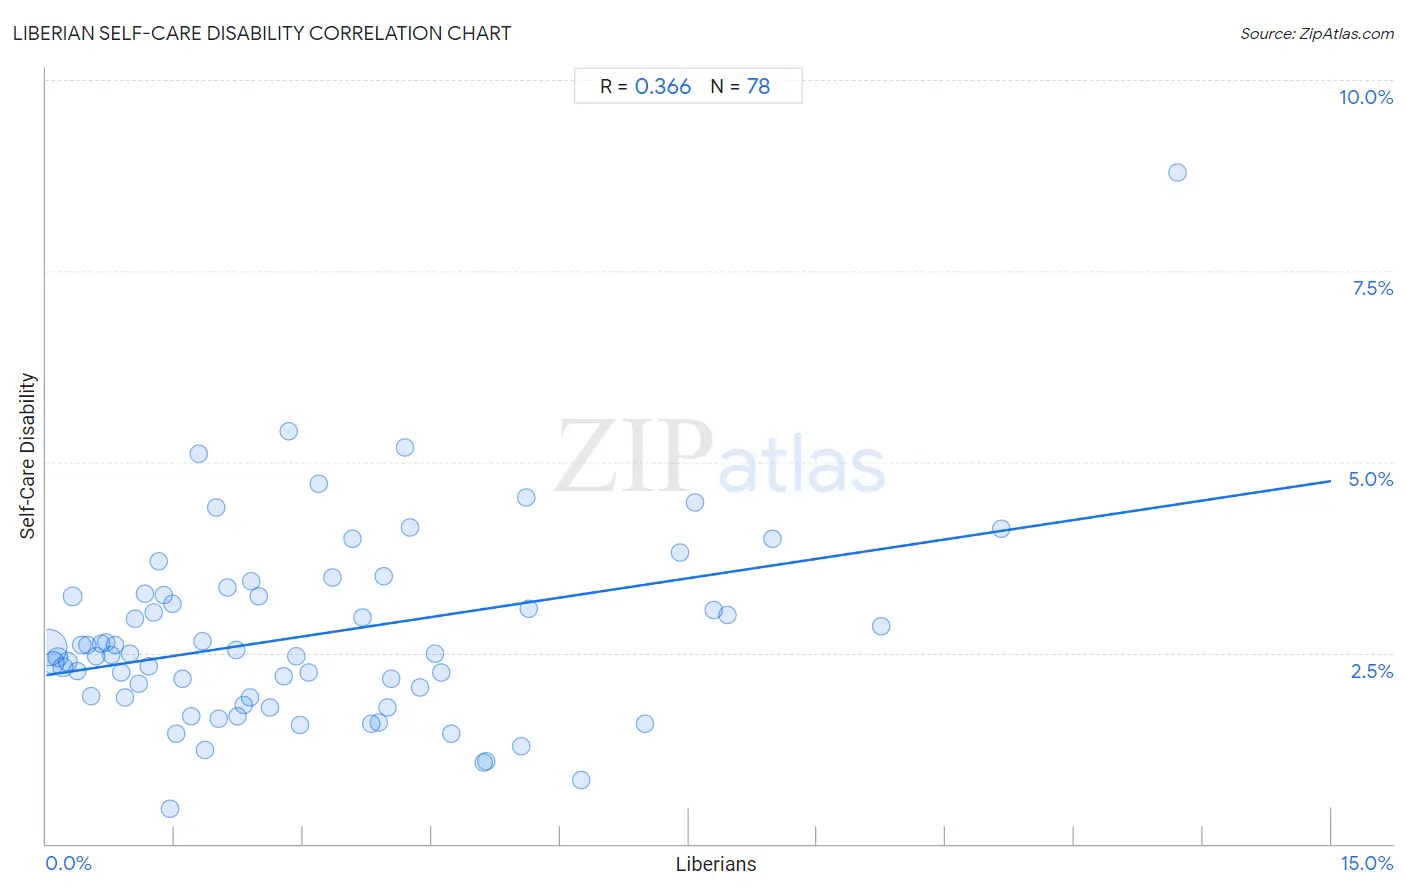
Liberian Self-Care Disability Correlation Chart
The statistical analysis conducted on geographies consisting of 117,995,885 people shows a mild positive correlation between the proportion of Liberians and percentage of population with self-care disability in the United States with a correlation coefficient (R) of 0.366 and weighted average of 2.6%. On average, for every 1% (one percent) increase in Liberians within a typical geography, there is an increase of 0.17% in percentage of population with self-care disability.
It is essential to understand that the correlation between the percentage of Liberians and percentage of population with self-care disability does not imply a direct cause-and-effect relationship. It remains uncertain whether the presence of Liberians influences an upward or downward trend in the level of percentage of population with self-care disability within an area, or if Liberians simply ended up residing in those areas with higher or lower levels of percentage of population with self-care disability due to other factors.
Demographics Similar to Liberians by Self-Care Disability
In terms of self-care disability, the demographic groups most similar to Liberians are Vietnamese (2.6%, a difference of 0.010%), Albanian (2.6%, a difference of 0.040%), Bahamian (2.6%, a difference of 0.040%), Immigrants from Guatemala (2.6%, a difference of 0.070%), and Bermudan (2.6%, a difference of 0.11%).
| Demographics | Rating | Rank | Self-Care Disability |
| Chinese | 2.9 /100 | #226 | Tragic 2.6% |
| Immigrants from Philippines | 2.7 /100 | #227 | Tragic 2.6% |
| Guatemalans | 2.7 /100 | #228 | Tragic 2.6% |
| Guamanians/Chamorros | 2.5 /100 | #229 | Tragic 2.6% |
| Immigrants from Ecuador | 2.5 /100 | #230 | Tragic 2.6% |
| Immigrants from Guatemala | 2.2 /100 | #231 | Tragic 2.6% |
| Albanians | 2.2 /100 | #232 | Tragic 2.6% |
| Liberians | 2.1 /100 | #233 | Tragic 2.6% |
| Vietnamese | 2.1 /100 | #234 | Tragic 2.6% |
| Bahamians | 2.0 /100 | #235 | Tragic 2.6% |
| Bermudans | 1.9 /100 | #236 | Tragic 2.6% |
| Immigrants from Senegal | 1.6 /100 | #237 | Tragic 2.6% |
| Senegalese | 1.3 /100 | #238 | Tragic 2.6% |
| Immigrants from Panama | 1.2 /100 | #239 | Tragic 2.6% |
| Marshallese | 1.2 /100 | #240 | Tragic 2.6% |
Liberian Self-Care Disability Correlation Summary
| Measurement | Liberian Data | Self-Care Disability Data |
| Minimum | 0.025% | 0.46% |
| Maximum | 13.2% | 8.8% |
| Range | 13.2% | 8.3% |
| Mean | 3.1% | 2.7% |
| Median | 2.3% | 2.5% |
| Interquartile 25% (IQ1) | 1.1% | 1.9% |
| Interquartile 75% (IQ3) | 4.2% | 3.2% |
| Interquartile Range (IQR) | 3.2% | 1.3% |
| Standard Deviation (Sample) | 2.7% | 1.3% |
| Standard Deviation (Population) | 2.7% | 1.2% |
Correlation Details
| Liberian Percentile | Sample Size | Self-Care Disability |
[ 0.0% - 0.5% ] 0.025% | 72,209,758 | 2.6% |
[ 0.0% - 0.5% ] 0.083% | 16,952,440 | 2.4% |
[ 0.0% - 0.5% ] 0.14% | 6,831,200 | 2.4% |
[ 0.0% - 0.5% ] 0.19% | 6,935,810 | 2.3% |
[ 0.0% - 0.5% ] 0.25% | 2,163,776 | 2.4% |
[ 0.0% - 0.5% ] 0.31% | 3,795,237 | 3.2% |
[ 0.0% - 0.5% ] 0.36% | 1,400,871 | 2.3% |
[ 0.0% - 0.5% ] 0.42% | 783,098 | 2.6% |
[ 0.0% - 0.5% ] 0.48% | 763,197 | 2.6% |
[ 0.5% - 1.0% ] 0.52% | 697,047 | 1.9% |
[ 0.5% - 1.0% ] 0.59% | 597,995 | 2.5% |
[ 0.5% - 1.0% ] 0.64% | 397,435 | 2.6% |
[ 0.5% - 1.0% ] 0.69% | 397,279 | 2.6% |
[ 0.5% - 1.0% ] 0.75% | 414,838 | 2.5% |
[ 0.5% - 1.0% ] 0.81% | 283,163 | 2.6% |
[ 0.5% - 1.0% ] 0.87% | 226,053 | 2.2% |
[ 0.5% - 1.0% ] 0.92% | 199,358 | 1.9% |
[ 0.5% - 1.0% ] 0.97% | 342,275 | 2.5% |
[ 1.0% - 1.5% ] 1.03% | 136,067 | 2.9% |
[ 1.0% - 1.5% ] 1.08% | 108,683 | 2.1% |
[ 1.0% - 1.5% ] 1.15% | 251,502 | 3.3% |
[ 1.0% - 1.5% ] 1.20% | 105,604 | 2.3% |
[ 1.0% - 1.5% ] 1.25% | 268,406 | 3.0% |
[ 1.0% - 1.5% ] 1.32% | 55,474 | 3.7% |
[ 1.0% - 1.5% ] 1.37% | 61,724 | 3.2% |
[ 1.0% - 1.5% ] 1.44% | 6,812 | 0.46% |
[ 1.0% - 1.5% ] 1.47% | 146,040 | 3.1% |
[ 1.5% - 2.0% ] 1.51% | 66,828 | 1.4% |
[ 1.5% - 2.0% ] 1.60% | 7,574 | 2.2% |
[ 1.5% - 2.0% ] 1.69% | 202,789 | 1.7% |
[ 1.5% - 2.0% ] 1.78% | 2,759 | 5.1% |
[ 1.5% - 2.0% ] 1.82% | 97,674 | 2.7% |
[ 1.5% - 2.0% ] 1.86% | 7,003 | 1.2% |
[ 1.5% - 2.0% ] 1.99% | 3,978 | 4.4% |
[ 2.0% - 2.5% ] 2.02% | 127,319 | 1.6% |
[ 2.0% - 2.5% ] 2.11% | 3,264 | 3.4% |
[ 2.0% - 2.5% ] 2.21% | 8,762 | 2.5% |
[ 2.0% - 2.5% ] 2.24% | 24,437 | 1.7% |
[ 2.0% - 2.5% ] 2.30% | 35,606 | 1.8% |
[ 2.0% - 2.5% ] 2.37% | 66,702 | 1.9% |
[ 2.0% - 2.5% ] 2.40% | 14,960 | 3.4% |
[ 2.0% - 2.5% ] 2.48% | 12,799 | 3.2% |
[ 2.5% - 3.0% ] 2.61% | 54,042 | 1.8% |
[ 2.5% - 3.0% ] 2.77% | 24,283 | 2.2% |
[ 2.5% - 3.0% ] 2.83% | 12,388 | 5.4% |
[ 2.5% - 3.0% ] 2.92% | 67,773 | 2.5% |
[ 2.5% - 3.0% ] 2.96% | 4,523 | 1.6% |
[ 3.0% - 3.5% ] 3.07% | 5,506 | 2.2% |
[ 3.0% - 3.5% ] 3.17% | 39,099 | 4.7% |
[ 3.0% - 3.5% ] 3.34% | 31,812 | 3.5% |
[ 3.5% - 4.0% ] 3.57% | 12,277 | 4.0% |
[ 3.5% - 4.0% ] 3.69% | 34,414 | 3.0% |
[ 3.5% - 4.0% ] 3.79% | 9,507 | 1.6% |
[ 3.5% - 4.0% ] 3.88% | 5,747 | 1.6% |
[ 3.5% - 4.0% ] 3.94% | 1,751 | 3.5% |
[ 3.5% - 4.0% ] 3.98% | 12,860 | 1.8% |
[ 4.0% - 4.5% ] 4.03% | 36,213 | 2.2% |
[ 4.0% - 4.5% ] 4.18% | 5,976 | 5.2% |
[ 4.0% - 4.5% ] 4.24% | 8,630 | 4.1% |
[ 4.0% - 4.5% ] 4.37% | 60,800 | 2.0% |
[ 4.5% - 5.0% ] 4.54% | 84,951 | 2.5% |
[ 4.5% - 5.0% ] 4.61% | 8,244 | 2.2% |
[ 4.5% - 5.0% ] 4.73% | 7,617 | 1.4% |
[ 5.0% - 5.5% ] 5.11% | 23,967 | 1.1% |
[ 5.0% - 5.5% ] 5.13% | 23,856 | 1.1% |
[ 5.5% - 6.0% ] 5.54% | 13,075 | 1.3% |
[ 5.5% - 6.0% ] 5.60% | 22,493 | 4.5% |
[ 5.5% - 6.0% ] 5.63% | 21,620 | 3.1% |
[ 6.0% - 6.5% ] 6.25% | 272 | 0.83% |
[ 6.5% - 7.0% ] 6.98% | 2,849 | 1.6% |
[ 7.0% - 7.5% ] 7.39% | 4,762 | 3.8% |
[ 7.5% - 8.0% ] 7.57% | 31,018 | 4.5% |
[ 7.5% - 8.0% ] 7.79% | 33,109 | 3.1% |
[ 7.5% - 8.0% ] 7.96% | 32,967 | 3.0% |
[ 8.0% - 8.5% ] 8.47% | 10,682 | 4.0% |
[ 9.5% - 10.0% ] 9.75% | 28,392 | 2.8% |
[ 11.0% - 11.5% ] 11.15% | 3,156 | 4.1% |
[ 13.0% - 13.5% ] 13.21% | 1,658 | 8.8% |