Liberian Wage/Income Gap
COMPARE
Liberian
Select to Compare
Wage/Income Gap
Liberian Wage/Income Gap
21.4%
WAGE/INCOME GAP
100.0/ 100
METRIC RATING
41st/ 347
METRIC RANK
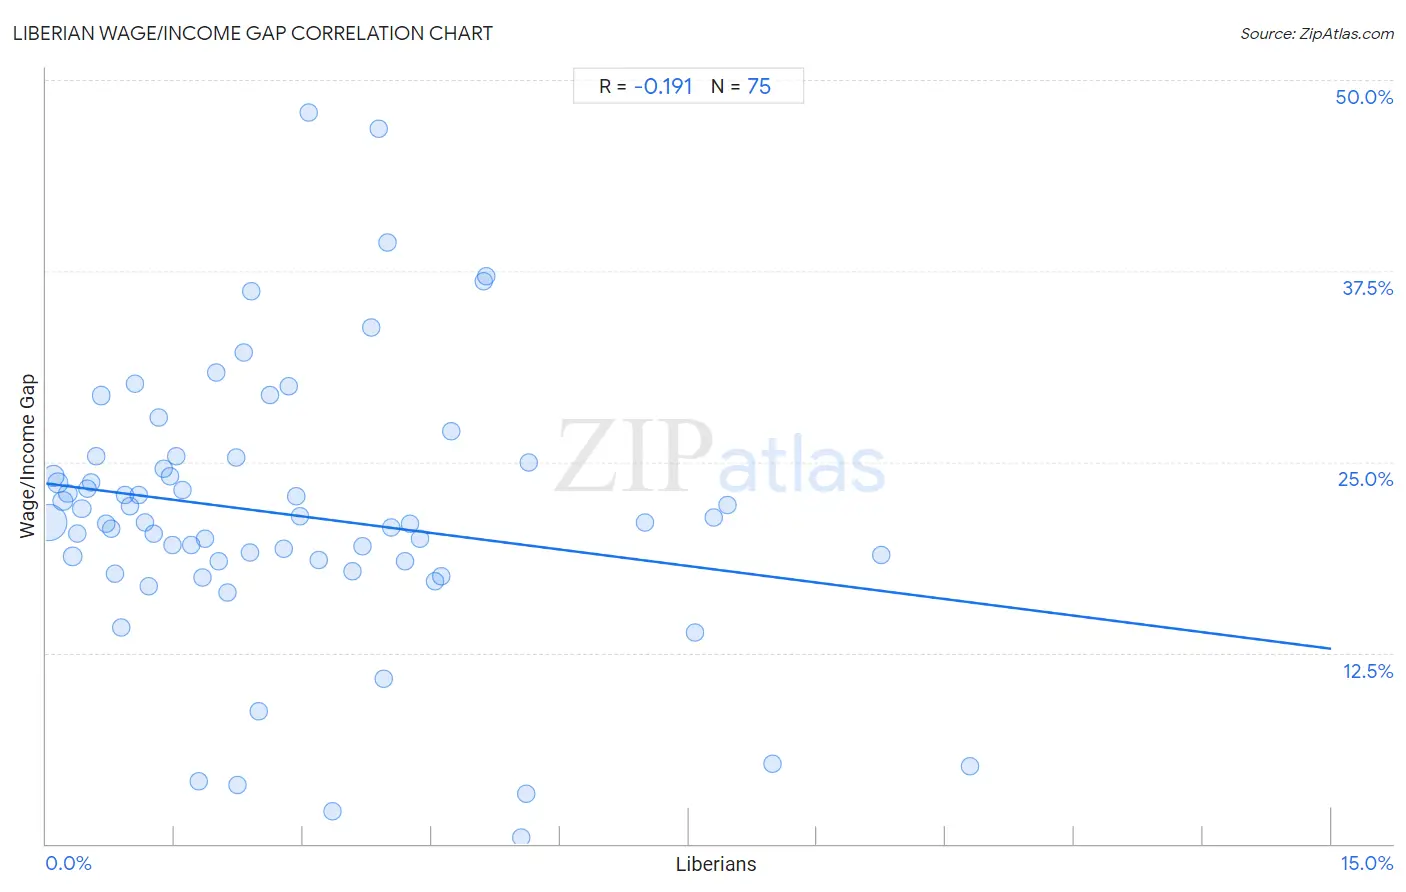
Liberian Wage/Income Gap Correlation Chart
The statistical analysis conducted on geographies consisting of 118,089,218 people shows a poor negative correlation between the proportion of Liberians and wage/income gap percentage in the United States with a correlation coefficient (R) of -0.191 and weighted average of 21.4%. On average, for every 1% (one percent) increase in Liberians within a typical geography, there is a decrease of 0.72% in wage/income gap percentage.
It is essential to understand that the correlation between the percentage of Liberians and wage/income gap percentage does not imply a direct cause-and-effect relationship. It remains uncertain whether the presence of Liberians influences an upward or downward trend in the level of wage/income gap percentage within an area, or if Liberians simply ended up residing in those areas with higher or lower levels of wage/income gap percentage due to other factors.
Demographics Similar to Liberians by Wage/Income Gap
In terms of wage/income gap, the demographic groups most similar to Liberians are Immigrants from Sierra Leone (21.4%, a difference of 0.0%), Sierra Leonean (21.4%, a difference of 0.060%), Immigrants from Eritrea (21.4%, a difference of 0.080%), Lumbee (21.3%, a difference of 0.48%), and U.S. Virgin Islander (21.5%, a difference of 0.52%).
| Demographics | Rating | Rank | Wage/Income Gap |
| Pima | 100.0 /100 | #34 | Exceptional 21.1% |
| Somalis | 100.0 /100 | #35 | Exceptional 21.2% |
| Belizeans | 100.0 /100 | #36 | Exceptional 21.2% |
| Immigrants from Somalia | 100.0 /100 | #37 | Exceptional 21.2% |
| Immigrants from Belize | 100.0 /100 | #38 | Exceptional 21.3% |
| Colville | 100.0 /100 | #39 | Exceptional 21.3% |
| Lumbee | 100.0 /100 | #40 | Exceptional 21.3% |
| Liberians | 100.0 /100 | #41 | Exceptional 21.4% |
| Immigrants from Sierra Leone | 100.0 /100 | #42 | Exceptional 21.4% |
| Sierra Leoneans | 100.0 /100 | #43 | Exceptional 21.4% |
| Immigrants from Eritrea | 100.0 /100 | #44 | Exceptional 21.4% |
| U.S. Virgin Islanders | 100.0 /100 | #45 | Exceptional 21.5% |
| Immigrants from Ethiopia | 100.0 /100 | #46 | Exceptional 21.6% |
| Immigrants from Congo | 100.0 /100 | #47 | Exceptional 21.7% |
| Blacks/African Americans | 100.0 /100 | #48 | Exceptional 21.7% |
Liberian Wage/Income Gap Correlation Summary
| Measurement | Liberian Data | Wage/Income Gap Data |
| Minimum | 0.025% | 0.44% |
| Maximum | 10.8% | 47.8% |
| Range | 10.8% | 47.4% |
| Mean | 2.9% | 21.5% |
| Median | 2.2% | 21.0% |
| Interquartile 25% (IQ1) | 1.0% | 18.5% |
| Interquartile 75% (IQ3) | 4.0% | 25.0% |
| Interquartile Range (IQR) | 3.0% | 6.5% |
| Standard Deviation (Sample) | 2.4% | 9.0% |
| Standard Deviation (Population) | 2.4% | 9.0% |
Correlation Details
| Liberian Percentile | Sample Size | Wage/Income Gap |
[ 0.0% - 0.5% ] 0.025% | 72,227,073 | 21.1% |
[ 0.0% - 0.5% ] 0.083% | 16,956,944 | 24.1% |
[ 0.0% - 0.5% ] 0.14% | 6,842,488 | 23.6% |
[ 0.0% - 0.5% ] 0.19% | 6,935,810 | 22.4% |
[ 0.0% - 0.5% ] 0.25% | 2,173,377 | 22.9% |
[ 0.0% - 0.5% ] 0.31% | 3,801,948 | 18.8% |
[ 0.0% - 0.5% ] 0.36% | 1,400,871 | 20.3% |
[ 0.0% - 0.5% ] 0.42% | 783,098 | 21.9% |
[ 0.0% - 0.5% ] 0.48% | 784,023 | 23.3% |
[ 0.5% - 1.0% ] 0.52% | 698,760 | 23.7% |
[ 0.5% - 1.0% ] 0.59% | 600,621 | 25.4% |
[ 0.5% - 1.0% ] 0.64% | 397,435 | 29.3% |
[ 0.5% - 1.0% ] 0.69% | 413,591 | 20.9% |
[ 0.5% - 1.0% ] 0.75% | 414,838 | 20.6% |
[ 0.5% - 1.0% ] 0.81% | 283,163 | 17.7% |
[ 0.5% - 1.0% ] 0.87% | 226,887 | 14.2% |
[ 0.5% - 1.0% ] 0.92% | 199,358 | 22.9% |
[ 0.5% - 1.0% ] 0.97% | 342,275 | 22.1% |
[ 1.0% - 1.5% ] 1.03% | 136,067 | 30.1% |
[ 1.0% - 1.5% ] 1.08% | 108,683 | 22.9% |
[ 1.0% - 1.5% ] 1.15% | 251,502 | 21.0% |
[ 1.0% - 1.5% ] 1.20% | 107,025 | 16.9% |
[ 1.0% - 1.5% ] 1.25% | 268,406 | 20.3% |
[ 1.0% - 1.5% ] 1.32% | 55,474 | 27.9% |
[ 1.0% - 1.5% ] 1.37% | 61,724 | 24.6% |
[ 1.0% - 1.5% ] 1.44% | 6,812 | 24.1% |
[ 1.0% - 1.5% ] 1.47% | 152,010 | 19.6% |
[ 1.5% - 2.0% ] 1.51% | 66,828 | 25.4% |
[ 1.5% - 2.0% ] 1.60% | 7,574 | 23.1% |
[ 1.5% - 2.0% ] 1.69% | 202,789 | 19.6% |
[ 1.5% - 2.0% ] 1.78% | 2,759 | 4.1% |
[ 1.5% - 2.0% ] 1.82% | 97,674 | 17.4% |
[ 1.5% - 2.0% ] 1.86% | 7,003 | 20.0% |
[ 1.5% - 2.0% ] 1.99% | 3,978 | 30.8% |
[ 2.0% - 2.5% ] 2.02% | 127,319 | 18.5% |
[ 2.0% - 2.5% ] 2.11% | 3,264 | 16.5% |
[ 2.0% - 2.5% ] 2.21% | 8,762 | 25.3% |
[ 2.0% - 2.5% ] 2.24% | 24,437 | 3.8% |
[ 2.0% - 2.5% ] 2.30% | 35,606 | 32.2% |
[ 2.0% - 2.5% ] 2.37% | 66,702 | 19.1% |
[ 2.0% - 2.5% ] 2.40% | 14,960 | 36.1% |
[ 2.0% - 2.5% ] 2.48% | 12,799 | 8.7% |
[ 2.5% - 3.0% ] 2.61% | 54,042 | 29.4% |
[ 2.5% - 3.0% ] 2.77% | 24,283 | 19.3% |
[ 2.5% - 3.0% ] 2.83% | 12,388 | 29.9% |
[ 2.5% - 3.0% ] 2.92% | 67,773 | 22.8% |
[ 2.5% - 3.0% ] 2.96% | 4,523 | 21.4% |
[ 3.0% - 3.5% ] 3.07% | 5,506 | 47.8% |
[ 3.0% - 3.5% ] 3.17% | 39,099 | 18.6% |
[ 3.0% - 3.5% ] 3.34% | 31,812 | 2.2% |
[ 3.5% - 4.0% ] 3.57% | 12,277 | 17.9% |
[ 3.5% - 4.0% ] 3.69% | 34,414 | 19.5% |
[ 3.5% - 4.0% ] 3.79% | 9,507 | 33.8% |
[ 3.5% - 4.0% ] 3.88% | 5,747 | 46.8% |
[ 3.5% - 4.0% ] 3.94% | 1,751 | 10.8% |
[ 3.5% - 4.0% ] 3.98% | 12,860 | 39.4% |
[ 4.0% - 4.5% ] 4.03% | 36,213 | 20.7% |
[ 4.0% - 4.5% ] 4.18% | 5,976 | 18.5% |
[ 4.0% - 4.5% ] 4.24% | 8,630 | 20.9% |
[ 4.0% - 4.5% ] 4.37% | 60,800 | 19.9% |
[ 4.5% - 5.0% ] 4.54% | 84,951 | 17.2% |
[ 4.5% - 5.0% ] 4.61% | 8,244 | 17.5% |
[ 4.5% - 5.0% ] 4.73% | 7,617 | 27.0% |
[ 5.0% - 5.5% ] 5.11% | 23,967 | 36.8% |
[ 5.0% - 5.5% ] 5.13% | 23,856 | 37.2% |
[ 5.5% - 6.0% ] 5.54% | 13,075 | 0.44% |
[ 5.5% - 6.0% ] 5.60% | 22,493 | 3.3% |
[ 5.5% - 6.0% ] 5.63% | 21,620 | 25.0% |
[ 6.5% - 7.0% ] 6.98% | 2,849 | 21.0% |
[ 7.5% - 8.0% ] 7.57% | 31,018 | 13.8% |
[ 7.5% - 8.0% ] 7.79% | 33,109 | 21.4% |
[ 7.5% - 8.0% ] 7.96% | 32,967 | 22.1% |
[ 8.0% - 8.5% ] 8.47% | 10,682 | 5.2% |
[ 9.5% - 10.0% ] 9.75% | 28,392 | 18.9% |
[ 10.5% - 11.0% ] 10.79% | 4,060 | 5.0% |