Liberian 4 or more Vehicles in Household
COMPARE
Liberian
Select to Compare
4 or more Vehicles in Household
Liberian 4 or more Vehicles in Household
5.3%
4+ VEHICLES AVAILABLE
0.1/ 100
METRIC RATING
292nd/ 347
METRIC RANK
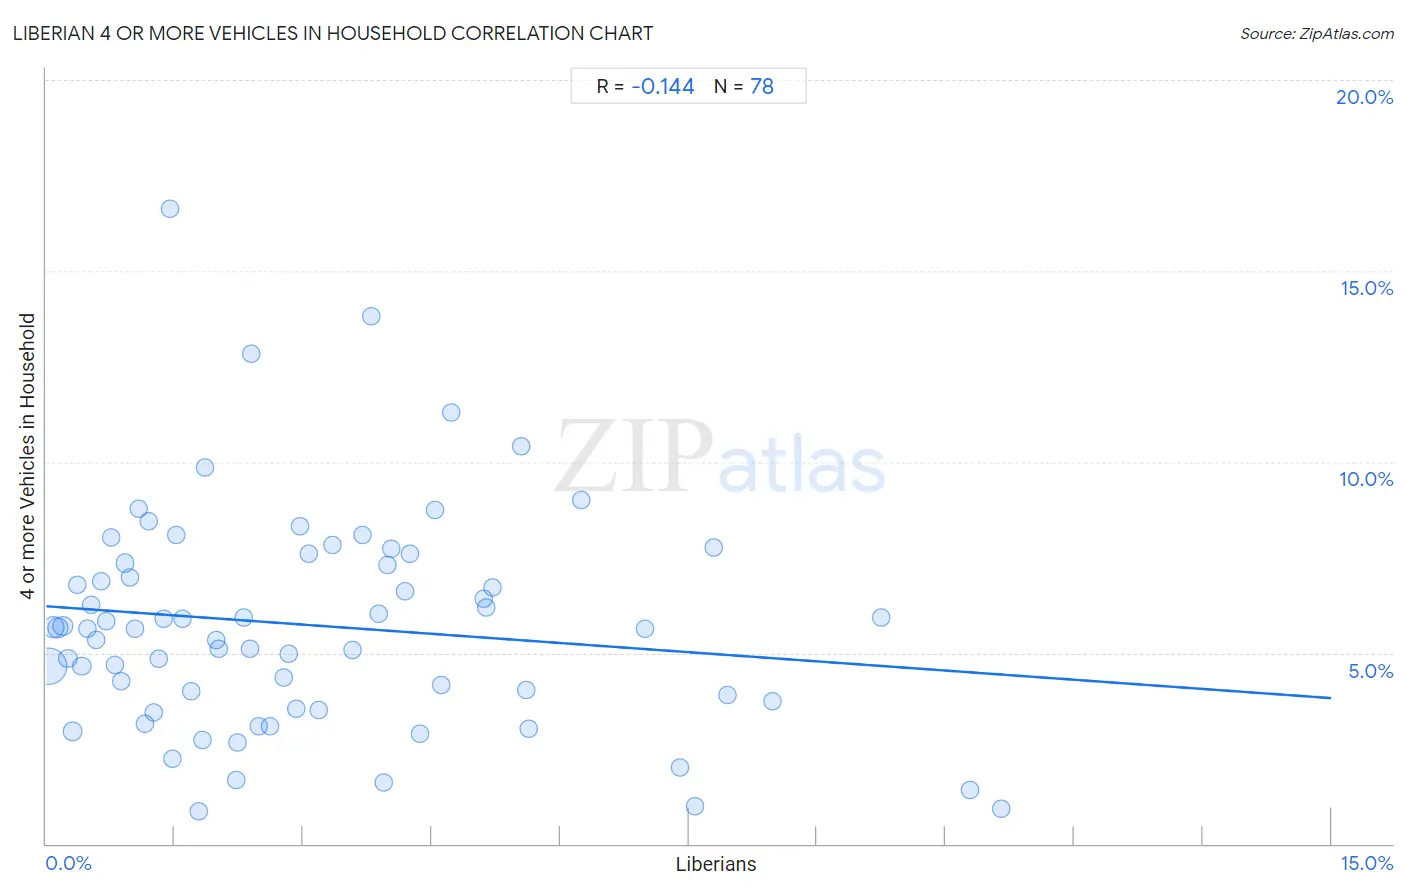
Liberian 4 or more Vehicles in Household Correlation Chart
The statistical analysis conducted on geographies consisting of 117,822,398 people shows a poor negative correlation between the proportion of Liberians and percentage of households with 4 or more vehicles available in the United States with a correlation coefficient (R) of -0.144 and weighted average of 5.3%. On average, for every 1% (one percent) increase in Liberians within a typical geography, there is a decrease of 0.16% in percentage of households with 4 or more vehicles available.
It is essential to understand that the correlation between the percentage of Liberians and percentage of households with 4 or more vehicles available does not imply a direct cause-and-effect relationship. It remains uncertain whether the presence of Liberians influences an upward or downward trend in the level of percentage of households with 4 or more vehicles available within an area, or if Liberians simply ended up residing in those areas with higher or lower levels of percentage of households with 4 or more vehicles available due to other factors.
Demographics Similar to Liberians by 4 or more Vehicles in Household
In terms of 4 or more vehicles in household, the demographic groups most similar to Liberians are Immigrants from Congo (5.2%, a difference of 0.030%), Ghanaian (5.2%, a difference of 0.090%), Immigrants from Bahamas (5.3%, a difference of 0.10%), Immigrants from Brazil (5.2%, a difference of 0.20%), and Israeli (5.2%, a difference of 0.38%).
| Demographics | Rating | Rank | 4 or more Vehicles in Household |
| Immigrants from Liberia | 0.2 /100 | #285 | Tragic 5.4% |
| Immigrants from Colombia | 0.2 /100 | #286 | Tragic 5.4% |
| Immigrants from Croatia | 0.2 /100 | #287 | Tragic 5.4% |
| Venezuelans | 0.2 /100 | #288 | Tragic 5.3% |
| Immigrants from Bosnia and Herzegovina | 0.2 /100 | #289 | Tragic 5.3% |
| Immigrants from Russia | 0.2 /100 | #290 | Tragic 5.3% |
| Immigrants from Bahamas | 0.1 /100 | #291 | Tragic 5.3% |
| Liberians | 0.1 /100 | #292 | Tragic 5.3% |
| Immigrants from Congo | 0.1 /100 | #293 | Tragic 5.2% |
| Ghanaians | 0.1 /100 | #294 | Tragic 5.2% |
| Immigrants from Brazil | 0.1 /100 | #295 | Tragic 5.2% |
| Israelis | 0.1 /100 | #296 | Tragic 5.2% |
| Immigrants from Venezuela | 0.1 /100 | #297 | Tragic 5.2% |
| Immigrants from South America | 0.1 /100 | #298 | Tragic 5.2% |
| Immigrants from Ghana | 0.1 /100 | #299 | Tragic 5.2% |
Liberian 4 or more Vehicles in Household Correlation Summary
| Measurement | Liberian Data | 4 or more Vehicles in Household Data |
| Minimum | 0.025% | 0.87% |
| Maximum | 11.2% | 16.6% |
| Range | 11.1% | 15.8% |
| Mean | 3.1% | 5.7% |
| Median | 2.4% | 5.6% |
| Interquartile 25% (IQ1) | 1.1% | 3.7% |
| Interquartile 75% (IQ3) | 4.4% | 7.3% |
| Interquartile Range (IQR) | 3.3% | 3.6% |
| Standard Deviation (Sample) | 2.6% | 2.9% |
| Standard Deviation (Population) | 2.6% | 2.9% |
Correlation Details
| Liberian Percentile | Sample Size | 4 or more Vehicles in Household |
[ 0.0% - 0.5% ] 0.025% | 72,146,984 | 4.7% |
[ 0.0% - 0.5% ] 0.083% | 16,852,053 | 5.7% |
[ 0.0% - 0.5% ] 0.14% | 6,813,002 | 5.7% |
[ 0.0% - 0.5% ] 0.19% | 6,935,810 | 5.7% |
[ 0.0% - 0.5% ] 0.25% | 2,163,776 | 4.9% |
[ 0.0% - 0.5% ] 0.31% | 3,795,237 | 3.0% |
[ 0.0% - 0.5% ] 0.36% | 1,398,906 | 6.8% |
[ 0.0% - 0.5% ] 0.42% | 783,098 | 4.6% |
[ 0.0% - 0.5% ] 0.48% | 781,131 | 5.6% |
[ 0.5% - 1.0% ] 0.52% | 697,047 | 6.3% |
[ 0.5% - 1.0% ] 0.59% | 597,995 | 5.3% |
[ 0.5% - 1.0% ] 0.64% | 375,191 | 6.9% |
[ 0.5% - 1.0% ] 0.69% | 405,097 | 5.8% |
[ 0.5% - 1.0% ] 0.75% | 414,838 | 8.0% |
[ 0.5% - 1.0% ] 0.81% | 282,654 | 4.7% |
[ 0.5% - 1.0% ] 0.87% | 226,053 | 4.2% |
[ 0.5% - 1.0% ] 0.92% | 199,358 | 7.3% |
[ 0.5% - 1.0% ] 0.97% | 342,275 | 7.0% |
[ 1.0% - 1.5% ] 1.03% | 136,067 | 5.6% |
[ 1.0% - 1.5% ] 1.08% | 108,683 | 8.8% |
[ 1.0% - 1.5% ] 1.15% | 251,502 | 3.1% |
[ 1.0% - 1.5% ] 1.20% | 105,604 | 8.4% |
[ 1.0% - 1.5% ] 1.25% | 268,406 | 3.4% |
[ 1.0% - 1.5% ] 1.32% | 55,474 | 4.8% |
[ 1.0% - 1.5% ] 1.37% | 61,724 | 5.9% |
[ 1.0% - 1.5% ] 1.44% | 6,812 | 16.6% |
[ 1.0% - 1.5% ] 1.47% | 152,010 | 2.2% |
[ 1.5% - 2.0% ] 1.51% | 66,828 | 8.1% |
[ 1.5% - 2.0% ] 1.60% | 7,574 | 5.9% |
[ 1.5% - 2.0% ] 1.69% | 202,789 | 4.0% |
[ 1.5% - 2.0% ] 1.78% | 2,759 | 0.87% |
[ 1.5% - 2.0% ] 1.82% | 97,674 | 2.7% |
[ 1.5% - 2.0% ] 1.86% | 7,003 | 9.9% |
[ 1.5% - 2.0% ] 1.99% | 3,978 | 5.3% |
[ 2.0% - 2.5% ] 2.02% | 127,319 | 5.1% |
[ 2.0% - 2.5% ] 2.21% | 8,762 | 1.7% |
[ 2.0% - 2.5% ] 2.24% | 24,437 | 2.7% |
[ 2.0% - 2.5% ] 2.30% | 35,606 | 5.9% |
[ 2.0% - 2.5% ] 2.37% | 66,702 | 5.1% |
[ 2.0% - 2.5% ] 2.40% | 14,960 | 12.8% |
[ 2.0% - 2.5% ] 2.48% | 12,799 | 3.1% |
[ 2.5% - 3.0% ] 2.61% | 54,042 | 3.1% |
[ 2.5% - 3.0% ] 2.77% | 24,283 | 4.3% |
[ 2.5% - 3.0% ] 2.83% | 12,388 | 5.0% |
[ 2.5% - 3.0% ] 2.92% | 67,773 | 3.5% |
[ 2.5% - 3.0% ] 2.96% | 4,523 | 8.3% |
[ 3.0% - 3.5% ] 3.07% | 5,506 | 7.6% |
[ 3.0% - 3.5% ] 3.17% | 39,099 | 3.5% |
[ 3.0% - 3.5% ] 3.34% | 31,812 | 7.8% |
[ 3.5% - 4.0% ] 3.57% | 12,277 | 5.1% |
[ 3.5% - 4.0% ] 3.69% | 34,414 | 8.1% |
[ 3.5% - 4.0% ] 3.79% | 9,507 | 13.8% |
[ 3.5% - 4.0% ] 3.88% | 5,747 | 6.0% |
[ 3.5% - 4.0% ] 3.94% | 1,751 | 1.6% |
[ 3.5% - 4.0% ] 3.98% | 12,860 | 7.3% |
[ 4.0% - 4.5% ] 4.03% | 36,213 | 7.7% |
[ 4.0% - 4.5% ] 4.18% | 5,976 | 6.6% |
[ 4.0% - 4.5% ] 4.24% | 8,630 | 7.6% |
[ 4.0% - 4.5% ] 4.37% | 60,800 | 2.9% |
[ 4.5% - 5.0% ] 4.54% | 84,951 | 8.8% |
[ 4.5% - 5.0% ] 4.61% | 8,244 | 4.1% |
[ 4.5% - 5.0% ] 4.73% | 7,617 | 11.3% |
[ 5.0% - 5.5% ] 5.11% | 23,967 | 6.4% |
[ 5.0% - 5.5% ] 5.13% | 23,856 | 6.2% |
[ 5.0% - 5.5% ] 5.20% | 1,730 | 6.7% |
[ 5.5% - 6.0% ] 5.54% | 13,075 | 10.4% |
[ 5.5% - 6.0% ] 5.60% | 22,493 | 4.0% |
[ 5.5% - 6.0% ] 5.63% | 21,620 | 3.0% |
[ 6.0% - 6.5% ] 6.25% | 272 | 9.0% |
[ 6.5% - 7.0% ] 6.98% | 2,849 | 5.6% |
[ 7.0% - 7.5% ] 7.39% | 4,762 | 2.0% |
[ 7.5% - 8.0% ] 7.57% | 31,018 | 0.97% |
[ 7.5% - 8.0% ] 7.79% | 33,109 | 7.7% |
[ 7.5% - 8.0% ] 7.96% | 32,967 | 3.9% |
[ 8.0% - 8.5% ] 8.47% | 10,682 | 3.7% |
[ 9.5% - 10.0% ] 9.75% | 28,392 | 5.9% |
[ 10.5% - 11.0% ] 10.79% | 4,060 | 1.4% |
[ 11.0% - 11.5% ] 11.15% | 3,156 | 0.92% |