Jordanian 4 or more Vehicles in Household
COMPARE
Jordanian
Select to Compare
4 or more Vehicles in Household
Jordanian 4 or more Vehicles in Household
6.6%
4+ VEHICLES AVAILABLE
82.1/ 100
METRIC RATING
139th/ 347
METRIC RANK
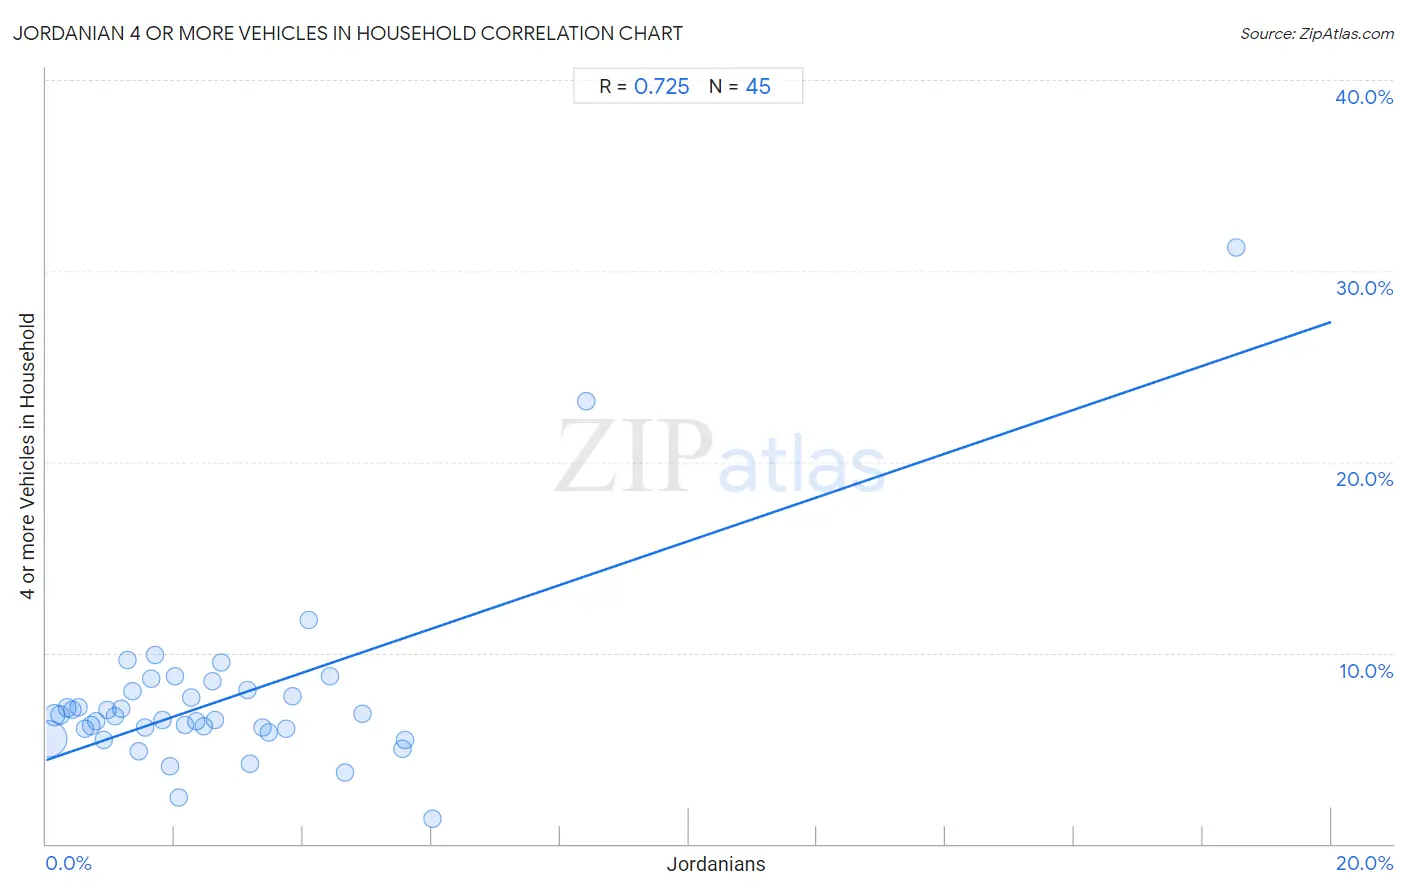
Jordanian 4 or more Vehicles in Household Correlation Chart
The statistical analysis conducted on geographies consisting of 166,057,251 people shows a strong positive correlation between the proportion of Jordanians and percentage of households with 4 or more vehicles available in the United States with a correlation coefficient (R) of 0.725 and weighted average of 6.6%. On average, for every 1% (one percent) increase in Jordanians within a typical geography, there is an increase of 1.1% in percentage of households with 4 or more vehicles available.
It is essential to understand that the correlation between the percentage of Jordanians and percentage of households with 4 or more vehicles available does not imply a direct cause-and-effect relationship. It remains uncertain whether the presence of Jordanians influences an upward or downward trend in the level of percentage of households with 4 or more vehicles available within an area, or if Jordanians simply ended up residing in those areas with higher or lower levels of percentage of households with 4 or more vehicles available due to other factors.
Demographics Similar to Jordanians by 4 or more Vehicles in Household
In terms of 4 or more vehicles in household, the demographic groups most similar to Jordanians are Slavic (6.6%, a difference of 0.080%), Australian (6.6%, a difference of 0.21%), Immigrants from Iraq (6.5%, a difference of 0.41%), Italian (6.6%, a difference of 0.43%), and Immigrants from Canada (6.5%, a difference of 0.54%).
| Demographics | Rating | Rank | 4 or more Vehicles in Household |
| Immigrants from Netherlands | 87.8 /100 | #132 | Excellent 6.6% |
| Armenians | 86.9 /100 | #133 | Excellent 6.6% |
| Ottawa | 86.9 /100 | #134 | Excellent 6.6% |
| Tohono O'odham | 86.7 /100 | #135 | Excellent 6.6% |
| Luxembourgers | 86.4 /100 | #136 | Excellent 6.6% |
| French Canadians | 85.4 /100 | #137 | Excellent 6.6% |
| Italians | 84.5 /100 | #138 | Excellent 6.6% |
| Jordanians | 82.1 /100 | #139 | Excellent 6.6% |
| Slavs | 81.6 /100 | #140 | Excellent 6.6% |
| Australians | 80.8 /100 | #141 | Excellent 6.6% |
| Immigrants from Iraq | 79.4 /100 | #142 | Good 6.5% |
| Immigrants from Canada | 78.6 /100 | #143 | Good 6.5% |
| Immigrants from North America | 78.5 /100 | #144 | Good 6.5% |
| Croatians | 77.8 /100 | #145 | Good 6.5% |
| Immigrants from Costa Rica | 74.4 /100 | #146 | Good 6.5% |
Jordanian 4 or more Vehicles in Household Correlation Summary
| Measurement | Jordanian Data | 4 or more Vehicles in Household Data |
| Minimum | 0.034% | 1.3% |
| Maximum | 18.5% | 31.2% |
| Range | 18.5% | 30.0% |
| Mean | 2.8% | 7.6% |
| Median | 2.1% | 6.7% |
| Interquartile 25% (IQ1) | 1.0% | 5.9% |
| Interquartile 75% (IQ3) | 3.6% | 8.0% |
| Interquartile Range (IQR) | 2.6% | 2.1% |
| Standard Deviation (Sample) | 3.0% | 4.8% |
| Standard Deviation (Population) | 3.0% | 4.7% |
Correlation Details
| Jordanian Percentile | Sample Size | 4 or more Vehicles in Household |
[ 0.0% - 0.5% ] 0.034% | 122,712,813 | 5.5% |
[ 0.0% - 0.5% ] 0.13% | 22,101,822 | 6.7% |
[ 0.0% - 0.5% ] 0.22% | 8,431,139 | 6.8% |
[ 0.0% - 0.5% ] 0.32% | 3,360,370 | 7.1% |
[ 0.0% - 0.5% ] 0.41% | 2,328,545 | 7.0% |
[ 0.5% - 1.0% ] 0.51% | 2,321,218 | 7.2% |
[ 0.5% - 1.0% ] 0.60% | 861,646 | 6.0% |
[ 0.5% - 1.0% ] 0.70% | 651,450 | 6.2% |
[ 0.5% - 1.0% ] 0.79% | 663,275 | 6.4% |
[ 0.5% - 1.0% ] 0.89% | 480,928 | 5.4% |
[ 0.5% - 1.0% ] 0.96% | 434,656 | 7.0% |
[ 1.0% - 1.5% ] 1.06% | 443,461 | 6.7% |
[ 1.0% - 1.5% ] 1.17% | 78,032 | 7.0% |
[ 1.0% - 1.5% ] 1.26% | 112,755 | 9.6% |
[ 1.0% - 1.5% ] 1.34% | 154,050 | 8.0% |
[ 1.0% - 1.5% ] 1.43% | 190,537 | 4.9% |
[ 1.5% - 2.0% ] 1.54% | 119,427 | 6.1% |
[ 1.5% - 2.0% ] 1.63% | 117,444 | 8.6% |
[ 1.5% - 2.0% ] 1.70% | 20,608 | 9.9% |
[ 1.5% - 2.0% ] 1.82% | 42,803 | 6.5% |
[ 1.5% - 2.0% ] 1.92% | 39,861 | 4.1% |
[ 2.0% - 2.5% ] 2.01% | 50,561 | 8.8% |
[ 2.0% - 2.5% ] 2.06% | 11,189 | 2.4% |
[ 2.0% - 2.5% ] 2.16% | 1,155 | 6.2% |
[ 2.0% - 2.5% ] 2.26% | 31,259 | 7.7% |
[ 2.0% - 2.5% ] 2.33% | 14,915 | 6.4% |
[ 2.0% - 2.5% ] 2.46% | 55,025 | 6.2% |
[ 2.5% - 3.0% ] 2.59% | 23,173 | 8.5% |
[ 2.5% - 3.0% ] 2.62% | 38,144 | 6.5% |
[ 2.5% - 3.0% ] 2.71% | 17,280 | 9.5% |
[ 3.0% - 3.5% ] 3.14% | 3,317 | 8.1% |
[ 3.0% - 3.5% ] 3.16% | 8,535 | 4.2% |
[ 3.0% - 3.5% ] 3.36% | 2,026 | 6.1% |
[ 3.0% - 3.5% ] 3.46% | 7,804 | 5.8% |
[ 3.5% - 4.0% ] 3.74% | 11,084 | 6.0% |
[ 3.5% - 4.0% ] 3.82% | 11,977 | 7.7% |
[ 4.0% - 4.5% ] 4.09% | 38,010 | 11.7% |
[ 4.0% - 4.5% ] 4.42% | 8,220 | 8.8% |
[ 4.5% - 5.0% ] 4.65% | 20,564 | 3.7% |
[ 4.5% - 5.0% ] 4.92% | 1,381 | 6.8% |
[ 5.5% - 6.0% ] 5.55% | 9,960 | 4.9% |
[ 5.5% - 6.0% ] 5.59% | 6,496 | 5.4% |
[ 6.0% - 6.5% ] 6.01% | 8,024 | 1.3% |
[ 8.0% - 8.5% ] 8.41% | 10,258 | 23.2% |
[ 18.5% - 19.0% ] 18.52% | 54 | 31.2% |