Jordanian Married-Couple Family Poverty
COMPARE
Jordanian
Select to Compare
Married-Couple Family Poverty
Jordanian Married-Couple Family Poverty
4.8%
POVERTY | MARRIED-COUPLE FAMILIES
93.1/ 100
METRIC RATING
123rd/ 347
METRIC RANK
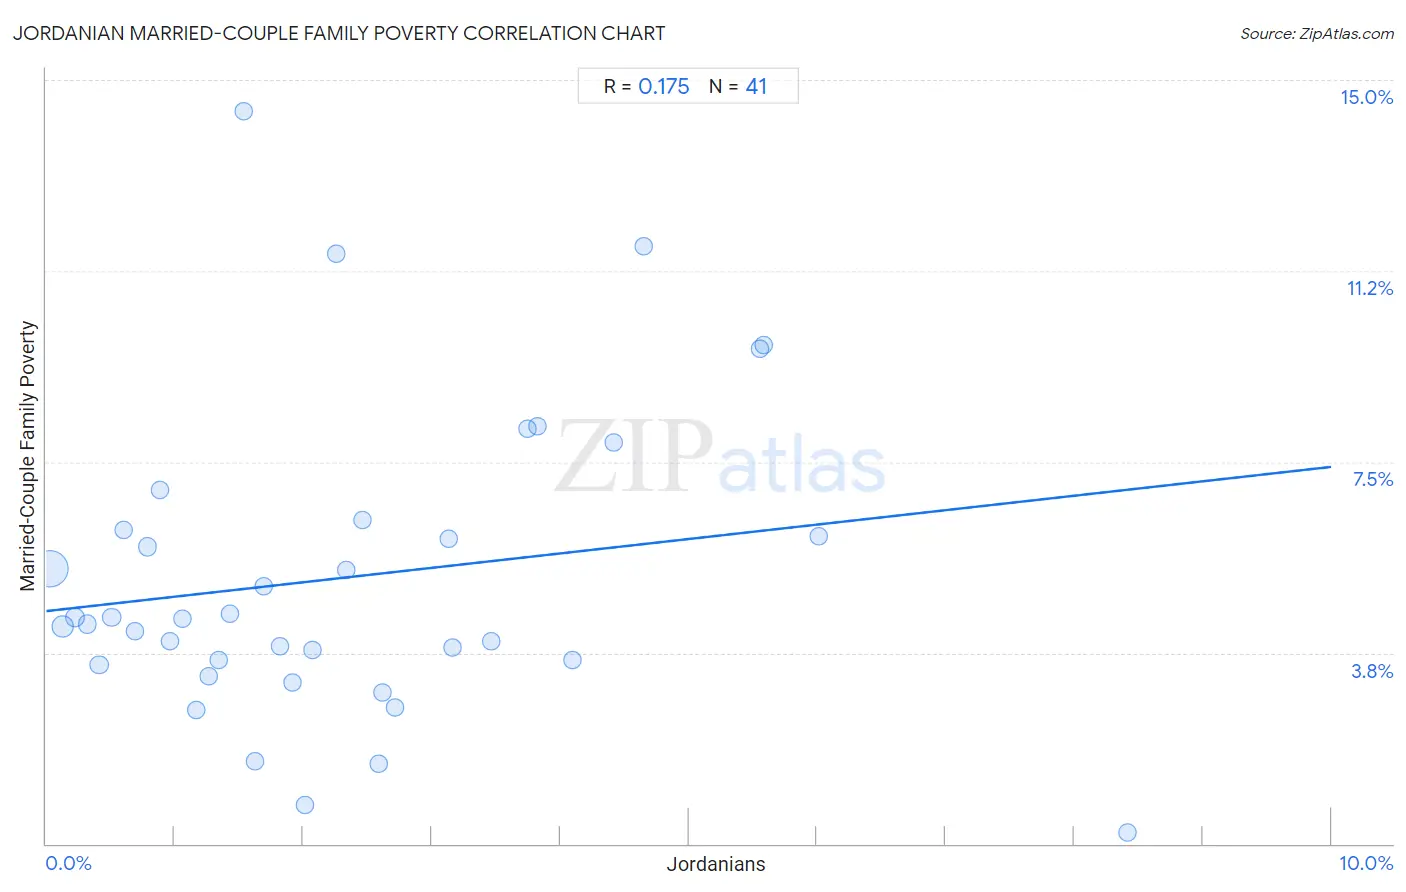
Jordanian Married-Couple Family Poverty Correlation Chart
The statistical analysis conducted on geographies consisting of 165,961,461 people shows a poor positive correlation between the proportion of Jordanians and poverty level among married-couple families in the United States with a correlation coefficient (R) of 0.175 and weighted average of 4.8%. On average, for every 1% (one percent) increase in Jordanians within a typical geography, there is an increase of 0.28% in poverty level among married-couple families.
It is essential to understand that the correlation between the percentage of Jordanians and poverty level among married-couple families does not imply a direct cause-and-effect relationship. It remains uncertain whether the presence of Jordanians influences an upward or downward trend in the level of poverty level among married-couple families within an area, or if Jordanians simply ended up residing in those areas with higher or lower levels of poverty level among married-couple families due to other factors.
Demographics Similar to Jordanians by Married-Couple Family Poverty
In terms of married-couple family poverty, the demographic groups most similar to Jordanians are White/Caucasian (4.8%, a difference of 0.020%), Indian (Asian) (4.8%, a difference of 0.060%), Immigrants from Southern Europe (4.8%, a difference of 0.16%), Romanian (4.8%, a difference of 0.27%), and Immigrants from Bosnia and Herzegovina (4.8%, a difference of 0.29%).
| Demographics | Rating | Rank | Married-Couple Family Poverty |
| Celtics | 94.8 /100 | #116 | Exceptional 4.8% |
| Kenyans | 94.7 /100 | #117 | Exceptional 4.8% |
| Immigrants from Philippines | 94.6 /100 | #118 | Exceptional 4.8% |
| Immigrants from Eastern Asia | 94.0 /100 | #119 | Exceptional 4.8% |
| Immigrants from Southern Europe | 93.4 /100 | #120 | Exceptional 4.8% |
| Indians (Asian) | 93.2 /100 | #121 | Exceptional 4.8% |
| Whites/Caucasians | 93.1 /100 | #122 | Exceptional 4.8% |
| Jordanians | 93.1 /100 | #123 | Exceptional 4.8% |
| Romanians | 92.5 /100 | #124 | Exceptional 4.8% |
| Immigrants from Bosnia and Herzegovina | 92.5 /100 | #125 | Exceptional 4.8% |
| Immigrants from Asia | 92.3 /100 | #126 | Exceptional 4.8% |
| Egyptians | 92.0 /100 | #127 | Exceptional 4.8% |
| Palestinians | 91.2 /100 | #128 | Exceptional 4.9% |
| Immigrants from Pakistan | 90.7 /100 | #129 | Exceptional 4.9% |
| Soviet Union | 90.7 /100 | #130 | Exceptional 4.9% |
Jordanian Married-Couple Family Poverty Correlation Summary
| Measurement | Jordanian Data | Married-Couple Family Poverty Data |
| Minimum | 0.034% | 0.23% |
| Maximum | 8.4% | 14.4% |
| Range | 8.4% | 14.1% |
| Mean | 2.3% | 5.2% |
| Median | 1.9% | 4.4% |
| Interquartile 25% (IQ1) | 0.92% | 3.6% |
| Interquartile 75% (IQ3) | 3.3% | 6.3% |
| Interquartile Range (IQR) | 2.4% | 2.7% |
| Standard Deviation (Sample) | 1.9% | 3.0% |
| Standard Deviation (Population) | 1.8% | 3.0% |
Correlation Details
| Jordanian Percentile | Sample Size | Married-Couple Family Poverty |
[ 0.0% - 0.5% ] 0.034% | 122,798,660 | 5.4% |
[ 0.0% - 0.5% ] 0.13% | 22,067,284 | 4.3% |
[ 0.0% - 0.5% ] 0.22% | 8,392,888 | 4.4% |
[ 0.0% - 0.5% ] 0.32% | 3,319,673 | 4.3% |
[ 0.0% - 0.5% ] 0.41% | 2,320,846 | 3.5% |
[ 0.5% - 1.0% ] 0.51% | 2,322,777 | 4.5% |
[ 0.5% - 1.0% ] 0.60% | 842,122 | 6.2% |
[ 0.5% - 1.0% ] 0.69% | 672,003 | 4.2% |
[ 0.5% - 1.0% ] 0.79% | 643,549 | 5.8% |
[ 0.5% - 1.0% ] 0.89% | 477,076 | 7.0% |
[ 0.5% - 1.0% ] 0.96% | 434,656 | 4.0% |
[ 1.0% - 1.5% ] 1.06% | 437,207 | 4.4% |
[ 1.0% - 1.5% ] 1.16% | 75,031 | 2.6% |
[ 1.0% - 1.5% ] 1.26% | 106,086 | 3.3% |
[ 1.0% - 1.5% ] 1.34% | 154,050 | 3.6% |
[ 1.0% - 1.5% ] 1.43% | 188,100 | 4.5% |
[ 1.5% - 2.0% ] 1.54% | 119,227 | 14.4% |
[ 1.5% - 2.0% ] 1.63% | 117,444 | 1.6% |
[ 1.5% - 2.0% ] 1.70% | 14,681 | 5.1% |
[ 1.5% - 2.0% ] 1.82% | 42,803 | 3.9% |
[ 1.5% - 2.0% ] 1.92% | 39,861 | 3.2% |
[ 2.0% - 2.5% ] 2.01% | 50,561 | 0.77% |
[ 2.0% - 2.5% ] 2.07% | 4,640 | 3.8% |
[ 2.0% - 2.5% ] 2.25% | 28,568 | 11.6% |
[ 2.0% - 2.5% ] 2.33% | 14,915 | 5.4% |
[ 2.0% - 2.5% ] 2.46% | 55,025 | 6.4% |
[ 2.5% - 3.0% ] 2.59% | 23,173 | 1.6% |
[ 2.5% - 3.0% ] 2.62% | 38,144 | 3.0% |
[ 2.5% - 3.0% ] 2.71% | 17,280 | 2.7% |
[ 3.0% - 3.5% ] 3.14% | 3,317 | 6.0% |
[ 3.0% - 3.5% ] 3.16% | 8,535 | 3.9% |
[ 3.0% - 3.5% ] 3.46% | 7,804 | 4.0% |
[ 3.5% - 4.0% ] 3.74% | 11,084 | 8.2% |
[ 3.5% - 4.0% ] 3.82% | 10,859 | 8.2% |
[ 4.0% - 4.5% ] 4.09% | 38,010 | 3.6% |
[ 4.0% - 4.5% ] 4.42% | 8,220 | 7.9% |
[ 4.5% - 5.0% ] 4.65% | 20,564 | 11.7% |
[ 5.5% - 6.0% ] 5.55% | 9,960 | 9.7% |
[ 5.5% - 6.0% ] 5.59% | 6,496 | 9.8% |
[ 6.0% - 6.5% ] 6.01% | 8,024 | 6.0% |
[ 8.0% - 8.5% ] 8.41% | 10,258 | 0.23% |