Jordanian Self-Care Disability
COMPARE
Jordanian
Select to Compare
Self-Care Disability
Jordanian Self-Care Disability
2.3%
SELF-CARE DISABILITY
99.7/ 100
METRIC RATING
47th/ 347
METRIC RANK
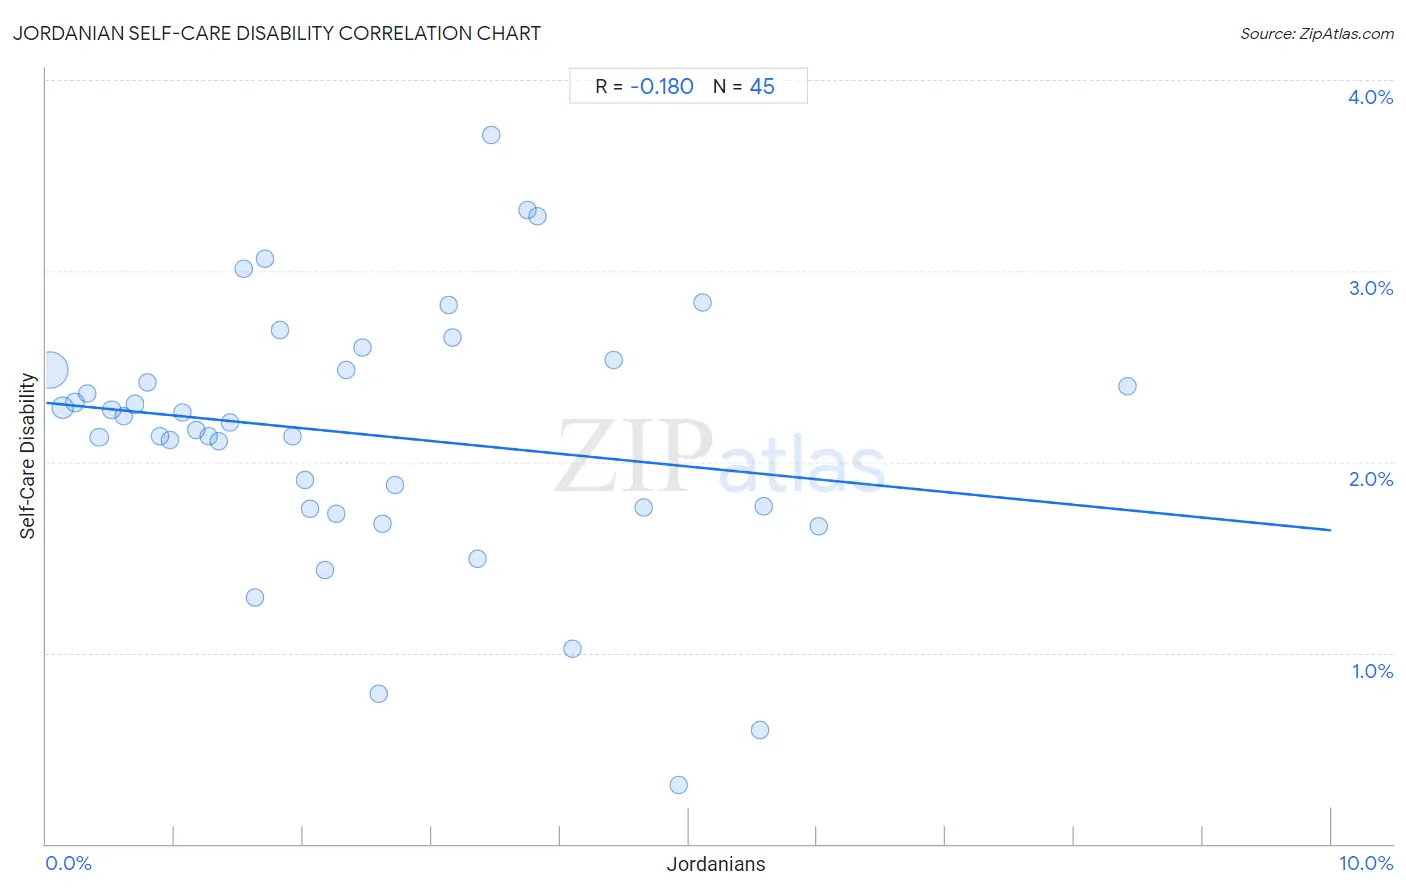
Jordanian Self-Care Disability Correlation Chart
The statistical analysis conducted on geographies consisting of 166,373,634 people shows a poor negative correlation between the proportion of Jordanians and percentage of population with self-care disability in the United States with a correlation coefficient (R) of -0.180 and weighted average of 2.3%. On average, for every 1% (one percent) increase in Jordanians within a typical geography, there is a decrease of 0.067% in percentage of population with self-care disability.
It is essential to understand that the correlation between the percentage of Jordanians and percentage of population with self-care disability does not imply a direct cause-and-effect relationship. It remains uncertain whether the presence of Jordanians influences an upward or downward trend in the level of percentage of population with self-care disability within an area, or if Jordanians simply ended up residing in those areas with higher or lower levels of percentage of population with self-care disability due to other factors.
Demographics Similar to Jordanians by Self-Care Disability
In terms of self-care disability, the demographic groups most similar to Jordanians are Immigrants from Malaysia (2.3%, a difference of 0.040%), Latvian (2.3%, a difference of 0.22%), Czech (2.3%, a difference of 0.23%), Immigrants from Brazil (2.3%, a difference of 0.24%), and Norwegian (2.3%, a difference of 0.31%).
| Demographics | Rating | Rank | Self-Care Disability |
| Iranians | 99.8 /100 | #40 | Exceptional 2.3% |
| Immigrants from Sudan | 99.8 /100 | #41 | Exceptional 2.3% |
| Immigrants from Uganda | 99.8 /100 | #42 | Exceptional 2.3% |
| Immigrants from Pakistan | 99.8 /100 | #43 | Exceptional 2.3% |
| Immigrants from South Africa | 99.8 /100 | #44 | Exceptional 2.3% |
| Norwegians | 99.8 /100 | #45 | Exceptional 2.3% |
| Czechs | 99.8 /100 | #46 | Exceptional 2.3% |
| Jordanians | 99.7 /100 | #47 | Exceptional 2.3% |
| Immigrants from Malaysia | 99.7 /100 | #48 | Exceptional 2.3% |
| Latvians | 99.7 /100 | #49 | Exceptional 2.3% |
| Immigrants from Brazil | 99.7 /100 | #50 | Exceptional 2.3% |
| Kenyans | 99.7 /100 | #51 | Exceptional 2.3% |
| Immigrants from Serbia | 99.6 /100 | #52 | Exceptional 2.3% |
| Australians | 99.6 /100 | #53 | Exceptional 2.3% |
| Argentineans | 99.6 /100 | #54 | Exceptional 2.3% |
Jordanian Self-Care Disability Correlation Summary
| Measurement | Jordanian Data | Self-Care Disability Data |
| Minimum | 0.034% | 0.31% |
| Maximum | 8.4% | 3.7% |
| Range | 8.4% | 3.4% |
| Mean | 2.5% | 2.1% |
| Median | 2.1% | 2.2% |
| Interquartile 25% (IQ1) | 1.0% | 1.8% |
| Interquartile 75% (IQ3) | 3.6% | 2.5% |
| Interquartile Range (IQR) | 2.6% | 0.75% |
| Standard Deviation (Sample) | 1.9% | 0.69% |
| Standard Deviation (Population) | 1.8% | 0.68% |
Correlation Details
| Jordanian Percentile | Sample Size | Self-Care Disability |
[ 0.0% - 0.5% ] 0.034% | 122,907,655 | 2.5% |
[ 0.0% - 0.5% ] 0.13% | 22,176,382 | 2.3% |
[ 0.0% - 0.5% ] 0.22% | 8,454,221 | 2.3% |
[ 0.0% - 0.5% ] 0.32% | 3,360,400 | 2.4% |
[ 0.0% - 0.5% ] 0.41% | 2,328,545 | 2.1% |
[ 0.5% - 1.0% ] 0.51% | 2,322,711 | 2.3% |
[ 0.5% - 1.0% ] 0.60% | 854,656 | 2.2% |
[ 0.5% - 1.0% ] 0.69% | 672,003 | 2.3% |
[ 0.5% - 1.0% ] 0.79% | 663,275 | 2.4% |
[ 0.5% - 1.0% ] 0.89% | 480,928 | 2.1% |
[ 0.5% - 1.0% ] 0.96% | 434,656 | 2.1% |
[ 1.0% - 1.5% ] 1.06% | 443,461 | 2.3% |
[ 1.0% - 1.5% ] 1.17% | 82,250 | 2.2% |
[ 1.0% - 1.5% ] 1.26% | 112,755 | 2.1% |
[ 1.0% - 1.5% ] 1.34% | 154,050 | 2.1% |
[ 1.0% - 1.5% ] 1.43% | 190,537 | 2.2% |
[ 1.5% - 2.0% ] 1.54% | 119,427 | 3.0% |
[ 1.5% - 2.0% ] 1.63% | 117,444 | 1.3% |
[ 1.5% - 2.0% ] 1.70% | 22,769 | 3.1% |
[ 1.5% - 2.0% ] 1.81% | 43,541 | 2.7% |
[ 1.5% - 2.0% ] 1.92% | 39,861 | 2.1% |
[ 2.0% - 2.5% ] 2.01% | 50,561 | 1.9% |
[ 2.0% - 2.5% ] 2.06% | 11,189 | 1.8% |
[ 2.0% - 2.5% ] 2.16% | 1,155 | 1.4% |
[ 2.0% - 2.5% ] 2.26% | 31,259 | 1.7% |
[ 2.0% - 2.5% ] 2.33% | 14,915 | 2.5% |
[ 2.0% - 2.5% ] 2.46% | 55,025 | 2.6% |
[ 2.5% - 3.0% ] 2.59% | 23,173 | 0.79% |
[ 2.5% - 3.0% ] 2.62% | 38,144 | 1.7% |
[ 2.5% - 3.0% ] 2.71% | 17,280 | 1.9% |
[ 3.0% - 3.5% ] 3.14% | 3,317 | 2.8% |
[ 3.0% - 3.5% ] 3.16% | 8,535 | 2.7% |
[ 3.0% - 3.5% ] 3.36% | 2,026 | 1.5% |
[ 3.0% - 3.5% ] 3.46% | 7,804 | 3.7% |
[ 3.5% - 4.0% ] 3.75% | 12,305 | 3.3% |
[ 3.5% - 4.0% ] 3.82% | 11,977 | 3.3% |
[ 4.0% - 4.5% ] 4.09% | 38,010 | 1.0% |
[ 4.0% - 4.5% ] 4.42% | 8,220 | 2.5% |
[ 4.5% - 5.0% ] 4.65% | 19,625 | 1.8% |
[ 4.5% - 5.0% ] 4.92% | 1,381 | 0.31% |
[ 5.0% - 5.5% ] 5.11% | 1,468 | 2.8% |
[ 5.5% - 6.0% ] 5.55% | 9,960 | 0.60% |
[ 5.5% - 6.0% ] 5.59% | 6,496 | 1.8% |
[ 6.0% - 6.5% ] 6.01% | 8,024 | 1.7% |
[ 8.0% - 8.5% ] 8.41% | 10,258 | 2.4% |