Jordanian Married-couple Households

COMPARE

Jordanian
Race
Ancestry
AfghanAfricanAlaska NativeAlaskan AthabascanAlbanianAleutAlsatianAmericanApacheArabArapahoArgentineanArmenianAssyrian/Chaldean/SyriacAustralianAustrianBahamianBangladeshiBarbadianBasqueBelgianBelizeanBermudanBhutaneseBlackfeetBolivianBrazilianBritishBritish West IndianBulgarianBurmeseCajunCambodianCanadianCape VerdeanCarpatho RusynCelticCentral AmericanCentral American IndianCherokeeCheyenneChickasawChileanChineseChippewaChoctawColombianColvilleComancheCosta RicanCreeCreekCroatianCrowCubanCypriotCzechCzechoslovakianDanishDelawareDominicanDutchDutch West IndianEastern EuropeanEcuadorianEgyptianEnglishEstonianEthiopianEuropeanFijianFilipinoFinnishFrenchFrench American IndianFrench CanadianGermanGerman RussianGhanaianGreekGuamanian/ChamorroGuatemalanGuyaneseHaitianHmongHonduranHopiHoumaHungarianIcelanderIndian (Asian)IndonesianInupiatIranianIraqiIrishIroquoisIsraeliItalianJamaicanJapaneseJordanianKenyanKiowaKoreanLaotianLatvianLebaneseLiberianLithuanianLumbeeLuxembourgerMacedonianMalaysianMalteseMarshalleseMenomineeMexicanMexican American IndianMongolianMoroccanNative HawaiianNavajoNepaleseNew ZealanderNicaraguanNigerianNorthern EuropeanNorwegianOkinawanOsageOttawaPaiutePakistaniPalestinianPanamanianParaguayanPennsylvania GermanPeruvianPimaPolishPortuguesePotawatomiPuebloPuerto RicanPuget Sound SalishRomanianRussianSalvadoranSamoanScandinavianScotch-IrishScottishSeminoleSenegaleseSerbianShoshoneSierra LeoneanSiouxSlavicSlovakSloveneSomaliSouth AfricanSouth AmericanSouth American IndianSoviet UnionSpaniardSpanishSpanish AmericanSpanish American IndianSri LankanSubsaharan AfricanSudaneseSwedishSwissSyrianTaiwaneseThaiTlingit-HaidaTohono O'OdhamTonganTrinidadian and TobagonianTsimshianTurkishU.S. Virgin IslanderUgandanUkrainianUruguayanUteVenezuelanVietnameseWelshWest IndianYakamaYaquiYugoslavianYumanYup'ikZimbabwean
Immigration
NonimmigrantsImmigrantsAfghanistanAfricaAlbaniaArgentinaArmeniaAsiaAustraliaAustriaBahamasBangladeshBarbadosBelarusBelgiumBelizeBoliviaBosnia and HerzegovinaBrazilBulgariaBurma/MyanmarCabo VerdeCambodiaCameroonCanadaCaribbeanCentral AmericaChileChinaColombiaCongoCosta RicaCroatiaCubaCzechoslovakiaDenmarkDominicaDominican RepublicEastern AfricaEastern AsiaEastern EuropeEcuadorEgyptEl SalvadorEnglandEritreaEthiopiaEuropeFijiFranceGermanyGhanaGreeceGrenadaGuatemalaGuyanaHaitiHondurasHong KongHungaryIndiaIndonesiaIranIraqIrelandIsraelItalyJamaicaJapanJordanKazakhstanKenyaKoreaKuwaitLaosLatin AmericaLatviaLebanonLiberiaLithuaniaMalaysiaMexicoMicronesiaMiddle AfricaMoldovaMoroccoNepalNetherlandsNicaraguaNigeriaNorth AmericaNorth MacedoniaNorthern AfricaNorthern EuropeNorwayOceaniaPakistanPanamaPeruPhilippinesPolandPortugalRomaniaRussiaSaudi ArabiaScotlandSenegalSerbiaSierra LeoneSingaporeSomaliaSouth AfricaSouth AmericaSouth Central AsiaSouth Eastern AsiaSouthern EuropeSpainSri LankaSt. Vincent and the GrenadinesSudanSwedenSwitzerlandSyriaTaiwanThailandTrinidad and TobagoTurkeyUgandaUkraineUruguayUzbekistanVenezuelaVietnamWest IndiesWestern AfricaWestern AsiaWestern EuropeYemenZaireZimbabweAzores
Select to Compare
Race
Ancestry
AfghanAfricanAlaska NativeAlaskan AthabascanAlbanianAleutAlsatianAmericanApacheArabArapahoArgentineanArmenianAssyrian/Chaldean/SyriacAustralianAustrianBahamianBangladeshiBarbadianBasqueBelgianBelizeanBermudanBhutaneseBlackfeetBolivianBrazilianBritishBritish West IndianBulgarianBurmeseCajunCambodianCanadianCape VerdeanCarpatho RusynCelticCentral AmericanCentral American IndianCherokeeCheyenneChickasawChileanChineseChippewaChoctawColombianColvilleComancheCosta RicanCreeCreekCroatianCrowCubanCypriotCzechCzechoslovakianDanishDelawareDominicanDutchDutch West IndianEastern EuropeanEcuadorianEgyptianEnglishEstonianEthiopianEuropeanFijianFilipinoFinnishFrenchFrench American IndianFrench CanadianGermanGerman RussianGhanaianGreekGuamanian/ChamorroGuatemalanGuyaneseHaitianHmongHonduranHopiHoumaHungarianIcelanderIndian (Asian)IndonesianInupiatIranianIraqiIrishIroquoisIsraeliItalianJamaicanJapaneseKenyanKiowaKoreanLaotianLatvianLebaneseLiberianLithuanianLumbeeLuxembourgerMacedonianMalaysianMalteseMarshalleseMenomineeMexicanMexican American IndianMongolianMoroccanNative HawaiianNavajoNepaleseNew ZealanderNicaraguanNigerianNorthern EuropeanNorwegianOkinawanOsageOttawaPaiutePakistaniPalestinianPanamanianParaguayanPennsylvania GermanPeruvianPimaPolishPortuguesePotawatomiPuebloPuerto RicanPuget Sound SalishRomanianRussianSalvadoranSamoanScandinavianScotch-IrishScottishSeminoleSenegaleseSerbianShoshoneSierra LeoneanSiouxSlavicSlovakSloveneSomaliSouth AfricanSouth AmericanSouth American IndianSoviet UnionSpaniardSpanishSpanish AmericanSpanish American IndianSri LankanSubsaharan AfricanSudaneseSwedishSwissSyrianTaiwaneseThaiTlingit-HaidaTohono O'OdhamTonganTrinidadian and TobagonianTsimshianTurkishU.S. Virgin IslanderUgandanUkrainianUruguayanUteVenezuelanVietnameseWelshWest IndianYakamaYaquiYugoslavianYumanYup'ikZimbabwean
Immigration
NonimmigrantsImmigrantsAfghanistanAfricaAlbaniaArgentinaArmeniaAsiaAustraliaAustriaBahamasBangladeshBarbadosBelarusBelgiumBelizeBoliviaBosnia and HerzegovinaBrazilBulgariaBurma/MyanmarCabo VerdeCambodiaCameroonCanadaCaribbeanCentral AmericaChileChinaColombiaCongoCosta RicaCroatiaCubaCzechoslovakiaDenmarkDominicaDominican RepublicEastern AfricaEastern AsiaEastern EuropeEcuadorEgyptEl SalvadorEnglandEritreaEthiopiaEuropeFijiFranceGermanyGhanaGreeceGrenadaGuatemalaGuyanaHaitiHondurasHong KongHungaryIndiaIndonesiaIranIraqIrelandIsraelItalyJamaicaJapanJordanKazakhstanKenyaKoreaKuwaitLaosLatin AmericaLatviaLebanonLiberiaLithuaniaMalaysiaMexicoMicronesiaMiddle AfricaMoldovaMoroccoNepalNetherlandsNicaraguaNigeriaNorth AmericaNorth MacedoniaNorthern AfricaNorthern EuropeNorwayOceaniaPakistanPanamaPeruPhilippinesPolandPortugalRomaniaRussiaSaudi ArabiaScotlandSenegalSerbiaSierra LeoneSingaporeSomaliaSouth AfricaSouth AmericaSouth Central AsiaSouth Eastern AsiaSouthern EuropeSpainSri LankaSt. Vincent and the GrenadinesSudanSwedenSwitzerlandSyriaTaiwanThailandTrinidad and TobagoTurkeyUgandaUkraineUruguayUzbekistanVenezuelaVietnamWest IndiesWestern AfricaWestern AsiaWestern EuropeYemenZaireZimbabweAzores
Married-couple Households
Income
Poverty
Unemployment
Labor Participation
Family Structure
Vehicle Availability
Education Level
Disability

Jordanian Married-couple Households
Exceptional

48.4%
MARRIED-COUPLE HOUSEHOLDS
98.9/ 100
METRIC RATING
66th/ 347
METRIC RANK

Jordanian Married-couple Households Correlation Chart

The statistical analysis conducted on geographies consisting of 166,389,697 people shows a poor positive correlation between the proportion of Jordanians and percentage of married-couple family households in the United States with a correlation coefficient (R) of 0.145 and weighted average of 48.4%. On average, for every 1% (one percent) increase in Jordanians within a typical geography, there is an increase of 0.55% in percentage of married-couple family households.
Jordanian Married-couple Households
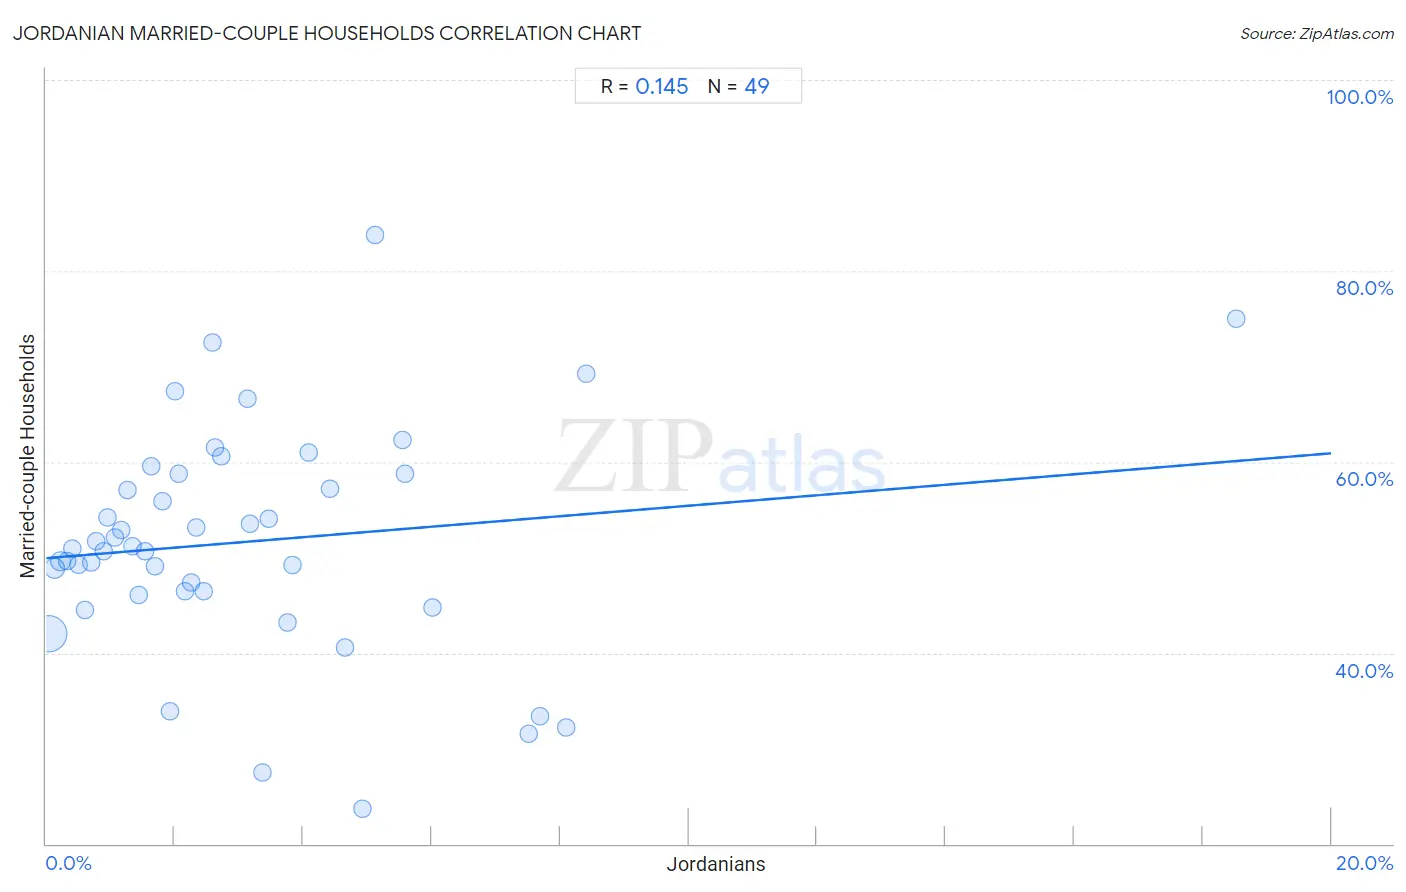
It is essential to understand that the correlation between the percentage of Jordanians and percentage of married-couple family households does not imply a direct cause-and-effect relationship. It remains uncertain whether the presence of Jordanians influences an upward or downward trend in the level of percentage of married-couple family households within an area, or if Jordanians simply ended up residing in those areas with higher or lower levels of percentage of married-couple family households due to other factors.

Demographics Similar to Jordanians by Married-couple Households

In terms of married-couple households, the demographic groups most similar to Jordanians are Romanian (48.4%, a difference of 0.0%), Immigrants from South Eastern Asia (48.4%, a difference of 0.020%), Immigrants from China (48.4%, a difference of 0.020%), Immigrants from Canada (48.4%, a difference of 0.030%), and Northern European (48.4%, a difference of 0.040%).
DemographicsRating | RankMarried-couple Households
Czechoslovakians
99.2
/100
|
#59
Exceptional
48.5%
Croatians
99.1
/100
|
#60
Exceptional
48.5%
Bulgarians
99.1
/100
|
#61
Exceptional
48.5%
Luxembourgers
99.1
/100
|
#62
Exceptional
48.5%
Basques
99.0
/100
|
#63
Exceptional
48.4%
Northern Europeans
99.0
/100
|
#64
Exceptional
48.4%
Immigrants from Canada
99.0
/100
|
#65
Exceptional
48.4%
Jordanians
98.9
/100
|
#66
Exceptional
48.4%
Romanians
98.9
/100
|
#67
Exceptional
48.4%
Immigrants from South Eastern Asia
98.9
/100
|
#68
Exceptional
48.4%
Immigrants from China
98.9
/100
|
#69
Exceptional
48.4%
Immigrants from North America
98.9
/100
|
#70
Exceptional
48.4%
Laotians
98.8
/100
|
#71
Exceptional
48.4%
Scotch-Irish
98.6
/100
|
#72
Exceptional
48.3%
Immigrants from Singapore
98.6
/100
|
#73
Exceptional
48.3%

Jordanian Married-couple Households Correlation Summary

MeasurementJordanian DataMarried-couple Households Data
Minimum0.034%23.6%
Maximum18.5%83.7%
Range18.5%60.1%
Mean3.1%51.6%
Median2.3%50.9%
Interquartile 25% (IQ1)1.1%46.2%
Interquartile 75% (IQ3)4.3%58.8%
Interquartile Range (IQR)3.1%12.6%
Standard Deviation (Sample)3.1%11.9%
Standard Deviation (Population)3.1%11.7%

Correlation Details

Jordanian PercentileSample SizeMarried-couple Households
[
0.0%
-
0.5%
]
0.034%
122,909,53442.0%
[
0.0%
-
0.5%
]
0.13%
22,167,98848.9%
[
0.0%
-
0.5%
]
0.22%
8,457,23349.6%
[
0.0%
-
0.5%
]
0.32%
3,366,45149.6%
[
0.0%
-
0.5%
]
0.41%
2,328,54550.9%
[
0.5%
-
1.0%
]
0.51%
2,327,29049.2%
[
0.5%
-
1.0%
]
0.60%
861,64644.5%
[
0.5%
-
1.0%
]
0.69%
672,00349.5%
[
0.5%
-
1.0%
]
0.79%
663,27551.6%
[
0.5%
-
1.0%
]
0.89%
480,92850.7%
[
0.5%
-
1.0%
]
0.96%
434,65654.1%
[
1.0%
-
1.5%
]
1.06%
443,46152.1%
[
1.0%
-
1.5%
]
1.17%
82,25052.9%
[
1.0%
-
1.5%
]
1.26%
112,75557.0%
[
1.0%
-
1.5%
]
1.34%
154,05051.1%
[
1.0%
-
1.5%
]
1.43%
190,53746.0%
[
1.5%
-
2.0%
]
1.54%
119,42750.7%
[
1.5%
-
2.0%
]
1.63%
117,44459.6%
[
1.5%
-
2.0%
]
1.70%
22,76949.0%
[
1.5%
-
2.0%
]
1.81%
43,54155.9%
[
1.5%
-
2.0%
]
1.92%
39,86133.9%
[
2.0%
-
2.5%
]
2.01%
50,56167.4%
[
2.0%
-
2.5%
]
2.06%
11,18958.8%
[
2.0%
-
2.5%
]
2.16%
1,15546.4%
[
2.0%
-
2.5%
]
2.26%
31,25947.4%
[
2.0%
-
2.5%
]
2.33%
14,91553.1%
[
2.0%
-
2.5%
]
2.46%
55,02546.5%
[
2.5%
-
3.0%
]
2.59%
23,17372.5%
[
2.5%
-
3.0%
]
2.62%
38,14461.5%
[
2.5%
-
3.0%
]
2.71%
17,28060.6%
[
3.0%
-
3.5%
]
3.14%
3,31766.6%
[
3.0%
-
3.5%
]
3.16%
8,53553.6%
[
3.0%
-
3.5%
]
3.36%
2,02627.5%
[
3.0%
-
3.5%
]
3.46%
7,80454.0%
[
3.5%
-
4.0%
]
3.75%
12,30543.2%
[
3.5%
-
4.0%
]
3.82%
11,97749.2%
[
4.0%
-
4.5%
]
4.09%
38,01061.0%
[
4.0%
-
4.5%
]
4.42%
8,22057.2%
[
4.5%
-
5.0%
]
4.65%
20,56440.5%
[
4.5%
-
5.0%
]
4.92%
1,38123.6%
[
5.0%
-
5.5%
]
5.11%
1,46883.7%
[
5.5%
-
6.0%
]
5.55%
9,96062.3%
[
5.5%
-
6.0%
]
5.59%
6,49658.8%
[
6.0%
-
6.5%
]
6.01%
8,02444.8%
[
7.0%
-
7.5%
]
7.50%
40031.6%
[
7.5%
-
8.0%
]
7.69%
18233.3%
[
8.0%
-
8.5%
]
8.09%
37132.1%
[
8.0%
-
8.5%
]
8.41%
10,25869.2%
[
18.5%
-
19.0%
]
18.52%
5475.0%