Immigrants from Western Asia 2 or more Vehicles in Household
COMPARE
Immigrants from Western Asia
Select to Compare
2 or more Vehicles in Household
Immigrants from Western Asia 2 or more Vehicles in Household
54.1%
2+ VEHICLES AVAILABLE
9.3/ 100
METRIC RATING
216th/ 347
METRIC RANK
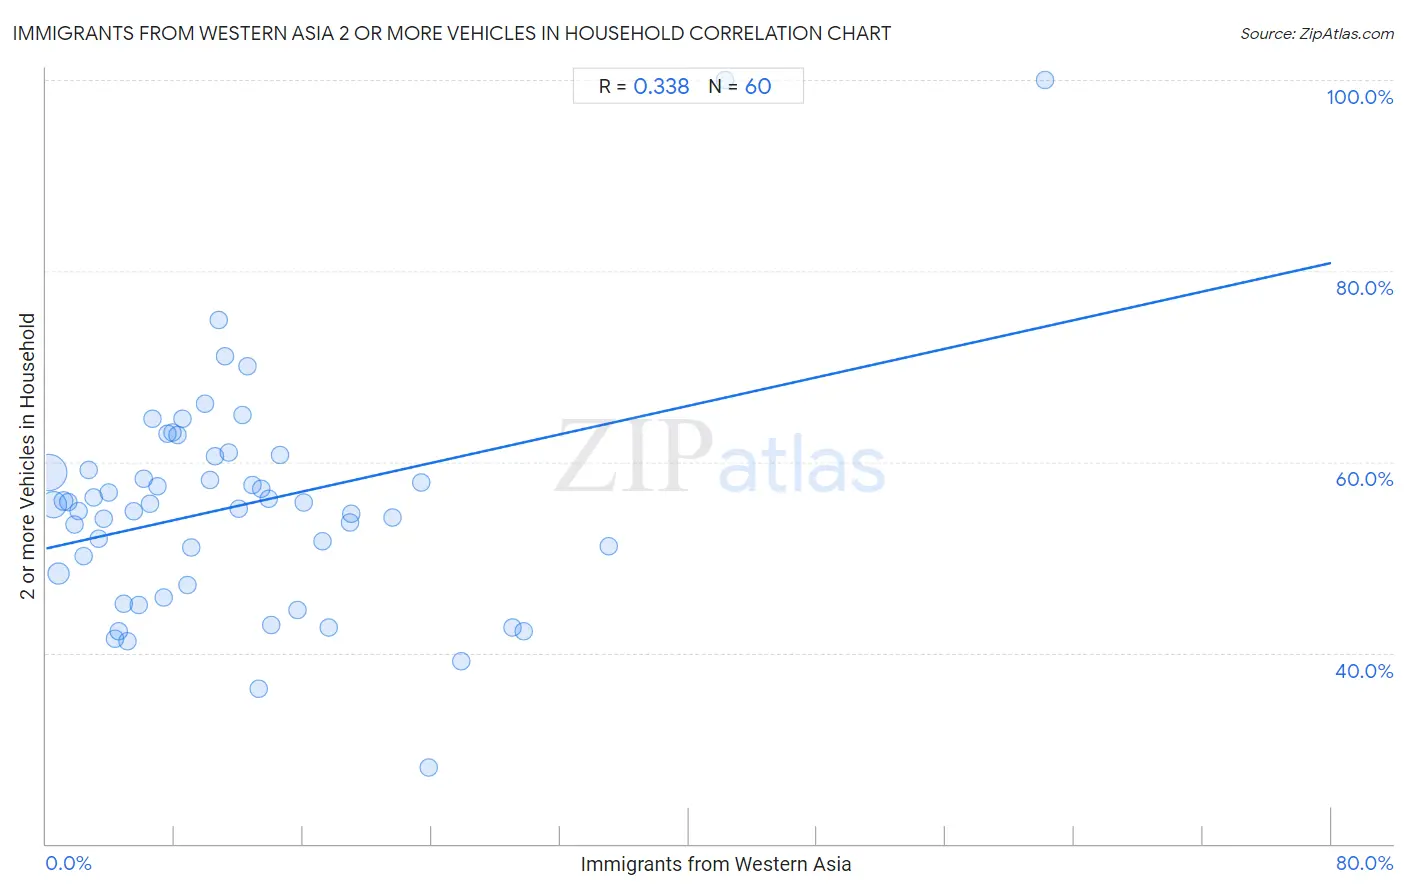
Immigrants from Western Asia 2 or more Vehicles in Household Correlation Chart
The statistical analysis conducted on geographies consisting of 404,211,339 people shows a mild positive correlation between the proportion of Immigrants from Western Asia and percentage of households with 2 or more vehicles available in the United States with a correlation coefficient (R) of 0.338 and weighted average of 54.1%. On average, for every 1% (one percent) increase in Immigrants from Western Asia within a typical geography, there is an increase of 0.37% in percentage of households with 2 or more vehicles available.
It is essential to understand that the correlation between the percentage of Immigrants from Western Asia and percentage of households with 2 or more vehicles available does not imply a direct cause-and-effect relationship. It remains uncertain whether the presence of Immigrants from Western Asia influences an upward or downward trend in the level of percentage of households with 2 or more vehicles available within an area, or if Immigrants from Western Asia simply ended up residing in those areas with higher or lower levels of percentage of households with 2 or more vehicles available due to other factors.
Demographics Similar to Immigrants from Western Asia by 2 or more Vehicles in Household
In terms of 2 or more vehicles in household, the demographic groups most similar to Immigrants from Western Asia are Aleut (54.1%, a difference of 0.0%), Immigrants from Czechoslovakia (54.1%, a difference of 0.020%), Guatemalan (54.1%, a difference of 0.040%), Immigrants from Chile (54.2%, a difference of 0.20%), and Immigrants from Hungary (54.2%, a difference of 0.22%).
| Demographics | Rating | Rank | 2 or more Vehicles in Household |
| Immigrants from Bulgaria | 12.0 /100 | #209 | Poor 54.3% |
| Immigrants from Saudi Arabia | 11.3 /100 | #210 | Poor 54.2% |
| Immigrants from Hungary | 11.3 /100 | #211 | Poor 54.2% |
| Immigrants from Chile | 11.1 /100 | #212 | Poor 54.2% |
| Guatemalans | 9.6 /100 | #213 | Tragic 54.1% |
| Immigrants from Czechoslovakia | 9.4 /100 | #214 | Tragic 54.1% |
| Aleuts | 9.3 /100 | #215 | Tragic 54.1% |
| Immigrants from Western Asia | 9.3 /100 | #216 | Tragic 54.1% |
| Immigrants from Burma/Myanmar | 7.1 /100 | #217 | Tragic 53.9% |
| Immigrants from Argentina | 6.8 /100 | #218 | Tragic 53.9% |
| South American Indians | 6.5 /100 | #219 | Tragic 53.9% |
| Taiwanese | 6.3 /100 | #220 | Tragic 53.9% |
| Immigrants from Singapore | 6.3 /100 | #221 | Tragic 53.9% |
| Kiowa | 6.2 /100 | #222 | Tragic 53.9% |
| Immigrants from Bosnia and Herzegovina | 5.5 /100 | #223 | Tragic 53.8% |
Immigrants from Western Asia 2 or more Vehicles in Household Correlation Summary
| Measurement | Immigrants from Western Asia Data | 2 or more Vehicles in Household Data |
| Minimum | 0.14% | 28.0% |
| Maximum | 62.2% | 100.0% |
| Range | 62.0% | 72.0% |
| Mean | 12.0% | 55.4% |
| Median | 9.5% | 55.6% |
| Interquartile 25% (IQ1) | 4.7% | 47.7% |
| Interquartile 75% (IQ3) | 15.1% | 59.9% |
| Interquartile Range (IQR) | 10.4% | 12.2% |
| Standard Deviation (Sample) | 11.0% | 12.2% |
| Standard Deviation (Population) | 10.9% | 12.1% |
Correlation Details
| Immigrants from Western Asia Percentile | Sample Size | 2 or more Vehicles in Household |
[ 0.0% - 0.5% ] 0.14% | 203,280,219 | 59.0% |
[ 0.0% - 0.5% ] 0.45% | 102,027,691 | 55.5% |
[ 0.5% - 1.0% ] 0.78% | 45,296,118 | 48.3% |
[ 1.0% - 1.5% ] 1.07% | 19,628,164 | 55.9% |
[ 1.0% - 1.5% ] 1.38% | 9,339,754 | 55.8% |
[ 1.5% - 2.0% ] 1.76% | 10,003,770 | 53.4% |
[ 2.0% - 2.5% ] 2.01% | 3,574,870 | 54.8% |
[ 2.0% - 2.5% ] 2.32% | 2,354,233 | 50.1% |
[ 2.5% - 3.0% ] 2.61% | 1,522,202 | 59.2% |
[ 2.5% - 3.0% ] 2.94% | 1,422,670 | 56.3% |
[ 3.0% - 3.5% ] 3.28% | 930,858 | 51.9% |
[ 3.5% - 4.0% ] 3.56% | 593,439 | 54.1% |
[ 3.5% - 4.0% ] 3.89% | 302,075 | 56.8% |
[ 4.0% - 4.5% ] 4.25% | 497,644 | 41.4% |
[ 4.5% - 5.0% ] 4.54% | 285,910 | 42.3% |
[ 4.5% - 5.0% ] 4.81% | 173,364 | 45.2% |
[ 5.0% - 5.5% ] 5.09% | 309,688 | 41.2% |
[ 5.0% - 5.5% ] 5.43% | 101,714 | 54.9% |
[ 5.5% - 6.0% ] 5.77% | 275,172 | 45.1% |
[ 6.0% - 6.5% ] 6.08% | 188,356 | 58.2% |
[ 6.0% - 6.5% ] 6.44% | 120,665 | 55.6% |
[ 6.5% - 7.0% ] 6.60% | 149,826 | 64.5% |
[ 6.5% - 7.0% ] 6.95% | 101,986 | 57.4% |
[ 7.0% - 7.5% ] 7.35% | 102,180 | 45.9% |
[ 7.5% - 8.0% ] 7.54% | 74,447 | 63.0% |
[ 7.5% - 8.0% ] 7.84% | 40,299 | 63.1% |
[ 8.0% - 8.5% ] 8.17% | 87,860 | 62.8% |
[ 8.0% - 8.5% ] 8.49% | 12,128 | 64.5% |
[ 8.5% - 9.0% ] 8.77% | 25,346 | 47.1% |
[ 9.0% - 9.5% ] 9.06% | 49,028 | 51.0% |
[ 9.5% - 10.0% ] 9.89% | 4,662 | 66.1% |
[ 10.0% - 10.5% ] 10.23% | 52,786 | 58.1% |
[ 10.0% - 10.5% ] 10.48% | 11,399 | 60.6% |
[ 10.5% - 11.0% ] 10.77% | 22,725 | 74.9% |
[ 11.0% - 11.5% ] 11.14% | 45,937 | 71.1% |
[ 11.0% - 11.5% ] 11.36% | 61,447 | 61.0% |
[ 12.0% - 12.5% ] 12.00% | 22,029 | 55.1% |
[ 12.0% - 12.5% ] 12.23% | 33,804 | 64.9% |
[ 12.0% - 12.5% ] 12.50% | 16 | 70.0% |
[ 12.5% - 13.0% ] 12.83% | 34,921 | 57.6% |
[ 13.0% - 13.5% ] 13.24% | 43,863 | 36.2% |
[ 13.0% - 13.5% ] 13.42% | 59,775 | 57.2% |
[ 13.5% - 14.0% ] 13.84% | 105,950 | 56.1% |
[ 13.5% - 14.0% ] 13.99% | 18,630 | 42.9% |
[ 14.5% - 15.0% ] 14.53% | 146,149 | 60.7% |
[ 15.5% - 16.0% ] 15.62% | 17,165 | 44.5% |
[ 16.0% - 16.5% ] 16.05% | 62,474 | 55.8% |
[ 17.0% - 17.5% ] 17.18% | 194,512 | 51.7% |
[ 17.5% - 18.0% ] 17.59% | 50,005 | 42.7% |
[ 18.5% - 19.0% ] 18.92% | 32,294 | 53.7% |
[ 18.5% - 19.0% ] 18.99% | 22,831 | 54.6% |
[ 21.5% - 22.0% ] 21.57% | 40,392 | 54.2% |
[ 23.0% - 23.5% ] 23.38% | 151,646 | 57.8% |
[ 23.5% - 24.0% ] 23.81% | 5,526 | 28.0% |
[ 25.5% - 26.0% ] 25.87% | 35,755 | 39.2% |
[ 29.0% - 29.5% ] 29.03% | 310 | 42.7% |
[ 29.5% - 30.0% ] 29.76% | 8,919 | 42.3% |
[ 35.0% - 35.5% ] 35.02% | 53,044 | 51.2% |
[ 42.0% - 42.5% ] 42.27% | 660 | 100.0% |
[ 62.0% - 62.5% ] 62.16% | 37 | 100.0% |