Immigrants from Western Asia Self-Care Disability
COMPARE
Immigrants from Western Asia
Select to Compare
Self-Care Disability
Immigrants from Western Asia Self-Care Disability
2.6%
SELF-CARE DISABILITY
0.6/ 100
METRIC RATING
245th/ 347
METRIC RANK
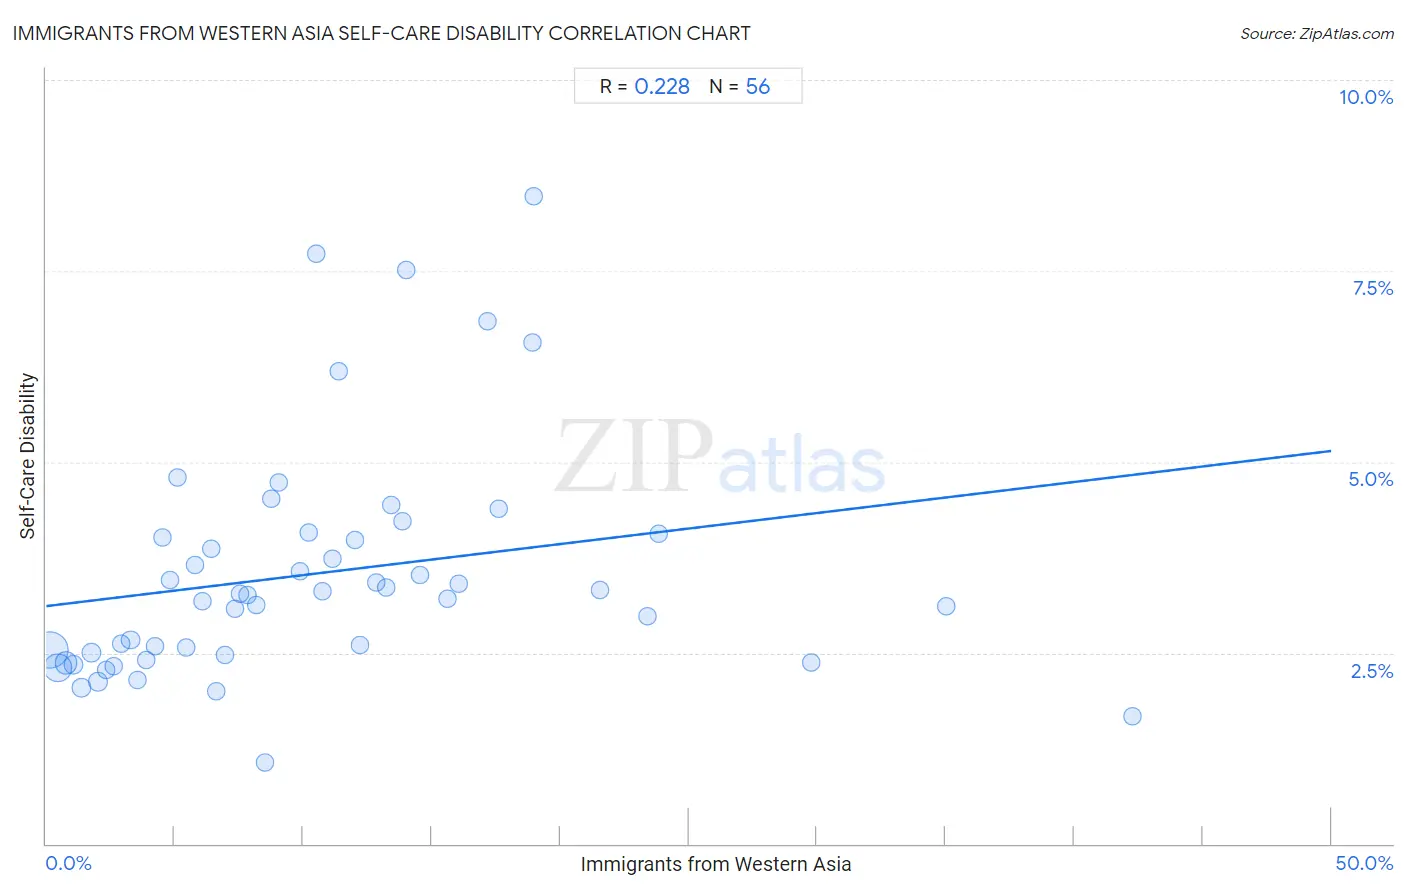
Immigrants from Western Asia Self-Care Disability Correlation Chart
The statistical analysis conducted on geographies consisting of 403,944,060 people shows a weak positive correlation between the proportion of Immigrants from Western Asia and percentage of population with self-care disability in the United States with a correlation coefficient (R) of 0.228 and weighted average of 2.6%. On average, for every 1% (one percent) increase in Immigrants from Western Asia within a typical geography, there is an increase of 0.041% in percentage of population with self-care disability.
It is essential to understand that the correlation between the percentage of Immigrants from Western Asia and percentage of population with self-care disability does not imply a direct cause-and-effect relationship. It remains uncertain whether the presence of Immigrants from Western Asia influences an upward or downward trend in the level of percentage of population with self-care disability within an area, or if Immigrants from Western Asia simply ended up residing in those areas with higher or lower levels of percentage of population with self-care disability due to other factors.
Demographics Similar to Immigrants from Western Asia by Self-Care Disability
In terms of self-care disability, the demographic groups most similar to Immigrants from Western Asia are Cheyenne (2.6%, a difference of 0.020%), Immigrants from Albania (2.6%, a difference of 0.15%), Nicaraguan (2.6%, a difference of 0.15%), Yuman (2.6%, a difference of 0.19%), and Hawaiian (2.6%, a difference of 0.23%).
| Demographics | Rating | Rank | Self-Care Disability |
| Senegalese | 1.3 /100 | #238 | Tragic 2.6% |
| Immigrants from Panama | 1.2 /100 | #239 | Tragic 2.6% |
| Marshallese | 1.2 /100 | #240 | Tragic 2.6% |
| Immigrants from Syria | 1.0 /100 | #241 | Tragic 2.6% |
| Spanish | 0.8 /100 | #242 | Tragic 2.6% |
| Hawaiians | 0.8 /100 | #243 | Tragic 2.6% |
| Yuman | 0.8 /100 | #244 | Tragic 2.6% |
| Immigrants from Western Asia | 0.6 /100 | #245 | Tragic 2.6% |
| Cheyenne | 0.6 /100 | #246 | Tragic 2.6% |
| Immigrants from Albania | 0.6 /100 | #247 | Tragic 2.6% |
| Nicaraguans | 0.6 /100 | #248 | Tragic 2.6% |
| Mexican American Indians | 0.5 /100 | #249 | Tragic 2.6% |
| Portuguese | 0.4 /100 | #250 | Tragic 2.6% |
| Immigrants from Liberia | 0.4 /100 | #251 | Tragic 2.6% |
| Immigrants from Bangladesh | 0.4 /100 | #252 | Tragic 2.6% |
Immigrants from Western Asia Self-Care Disability Correlation Summary
| Measurement | Immigrants from Western Asia Data | Self-Care Disability Data |
| Minimum | 0.14% | 1.1% |
| Maximum | 42.3% | 8.5% |
| Range | 42.1% | 7.4% |
| Mean | 10.5% | 3.5% |
| Median | 8.6% | 3.3% |
| Interquartile 25% (IQ1) | 4.4% | 2.5% |
| Interquartile 75% (IQ3) | 13.9% | 4.0% |
| Interquartile Range (IQR) | 9.5% | 1.5% |
| Standard Deviation (Sample) | 8.6% | 1.5% |
| Standard Deviation (Population) | 8.5% | 1.5% |
Correlation Details
| Immigrants from Western Asia Percentile | Sample Size | Self-Care Disability |
[ 0.0% - 0.5% ] 0.14% | 203,259,698 | 2.5% |
[ 0.0% - 0.5% ] 0.45% | 101,954,188 | 2.3% |
[ 0.5% - 1.0% ] 0.78% | 45,248,502 | 2.4% |
[ 1.0% - 1.5% ] 1.07% | 19,578,823 | 2.3% |
[ 1.0% - 1.5% ] 1.38% | 9,333,650 | 2.0% |
[ 1.5% - 2.0% ] 1.76% | 9,999,808 | 2.5% |
[ 2.0% - 2.5% ] 2.01% | 3,569,237 | 2.1% |
[ 2.0% - 2.5% ] 2.32% | 2,343,293 | 2.3% |
[ 2.5% - 3.0% ] 2.61% | 1,520,373 | 2.3% |
[ 2.5% - 3.0% ] 2.94% | 1,420,286 | 2.6% |
[ 3.0% - 3.5% ] 3.28% | 929,395 | 2.7% |
[ 3.5% - 4.0% ] 3.56% | 593,385 | 2.2% |
[ 3.5% - 4.0% ] 3.89% | 305,428 | 2.4% |
[ 4.0% - 4.5% ] 4.25% | 492,755 | 2.6% |
[ 4.5% - 5.0% ] 4.54% | 285,910 | 4.0% |
[ 4.5% - 5.0% ] 4.81% | 173,364 | 3.5% |
[ 5.0% - 5.5% ] 5.09% | 307,248 | 4.8% |
[ 5.0% - 5.5% ] 5.43% | 101,095 | 2.6% |
[ 5.5% - 6.0% ] 5.77% | 275,172 | 3.6% |
[ 6.0% - 6.5% ] 6.08% | 187,917 | 3.2% |
[ 6.0% - 6.5% ] 6.44% | 120,103 | 3.9% |
[ 6.5% - 7.0% ] 6.60% | 149,826 | 2.0% |
[ 6.5% - 7.0% ] 6.95% | 101,830 | 2.5% |
[ 7.0% - 7.5% ] 7.35% | 102,180 | 3.1% |
[ 7.5% - 8.0% ] 7.54% | 74,447 | 3.3% |
[ 7.5% - 8.0% ] 7.84% | 40,008 | 3.3% |
[ 8.0% - 8.5% ] 8.17% | 87,848 | 3.1% |
[ 8.0% - 8.5% ] 8.49% | 11,834 | 1.1% |
[ 8.5% - 9.0% ] 8.77% | 25,278 | 4.5% |
[ 9.0% - 9.5% ] 9.06% | 49,028 | 4.7% |
[ 9.5% - 10.0% ] 9.90% | 4,032 | 3.6% |
[ 10.0% - 10.5% ] 10.23% | 52,786 | 4.1% |
[ 10.0% - 10.5% ] 10.48% | 11,399 | 7.7% |
[ 10.5% - 11.0% ] 10.77% | 22,725 | 3.3% |
[ 11.0% - 11.5% ] 11.14% | 45,937 | 3.7% |
[ 11.0% - 11.5% ] 11.36% | 61,447 | 6.2% |
[ 12.0% - 12.5% ] 12.00% | 21,936 | 4.0% |
[ 12.0% - 12.5% ] 12.23% | 33,804 | 2.6% |
[ 12.5% - 13.0% ] 12.83% | 34,921 | 3.4% |
[ 13.0% - 13.5% ] 13.24% | 43,863 | 3.3% |
[ 13.0% - 13.5% ] 13.42% | 59,775 | 4.4% |
[ 13.5% - 14.0% ] 13.84% | 105,950 | 4.2% |
[ 13.5% - 14.0% ] 13.99% | 18,445 | 7.5% |
[ 14.5% - 15.0% ] 14.53% | 146,149 | 3.5% |
[ 15.5% - 16.0% ] 15.62% | 16,679 | 3.2% |
[ 16.0% - 16.5% ] 16.05% | 62,474 | 3.4% |
[ 17.0% - 17.5% ] 17.18% | 194,512 | 6.8% |
[ 17.5% - 18.0% ] 17.59% | 50,005 | 4.4% |
[ 18.5% - 19.0% ] 18.92% | 32,294 | 6.6% |
[ 18.5% - 19.0% ] 18.99% | 22,831 | 8.5% |
[ 21.5% - 22.0% ] 21.57% | 40,392 | 3.3% |
[ 23.0% - 23.5% ] 23.38% | 151,646 | 3.0% |
[ 23.5% - 24.0% ] 23.81% | 5,526 | 4.1% |
[ 29.5% - 30.0% ] 29.76% | 8,919 | 2.4% |
[ 35.0% - 35.5% ] 35.02% | 53,044 | 3.1% |
[ 42.0% - 42.5% ] 42.27% | 660 | 1.7% |