Immigrants from Western Asia 3 or more Vehicles in Household
COMPARE
Immigrants from Western Asia
Select to Compare
3 or more Vehicles in Household
Immigrants from Western Asia 3 or more Vehicles in Household
18.4%
3+ VEHICLES AVAILABLE
4.8/ 100
METRIC RATING
230th/ 347
METRIC RANK
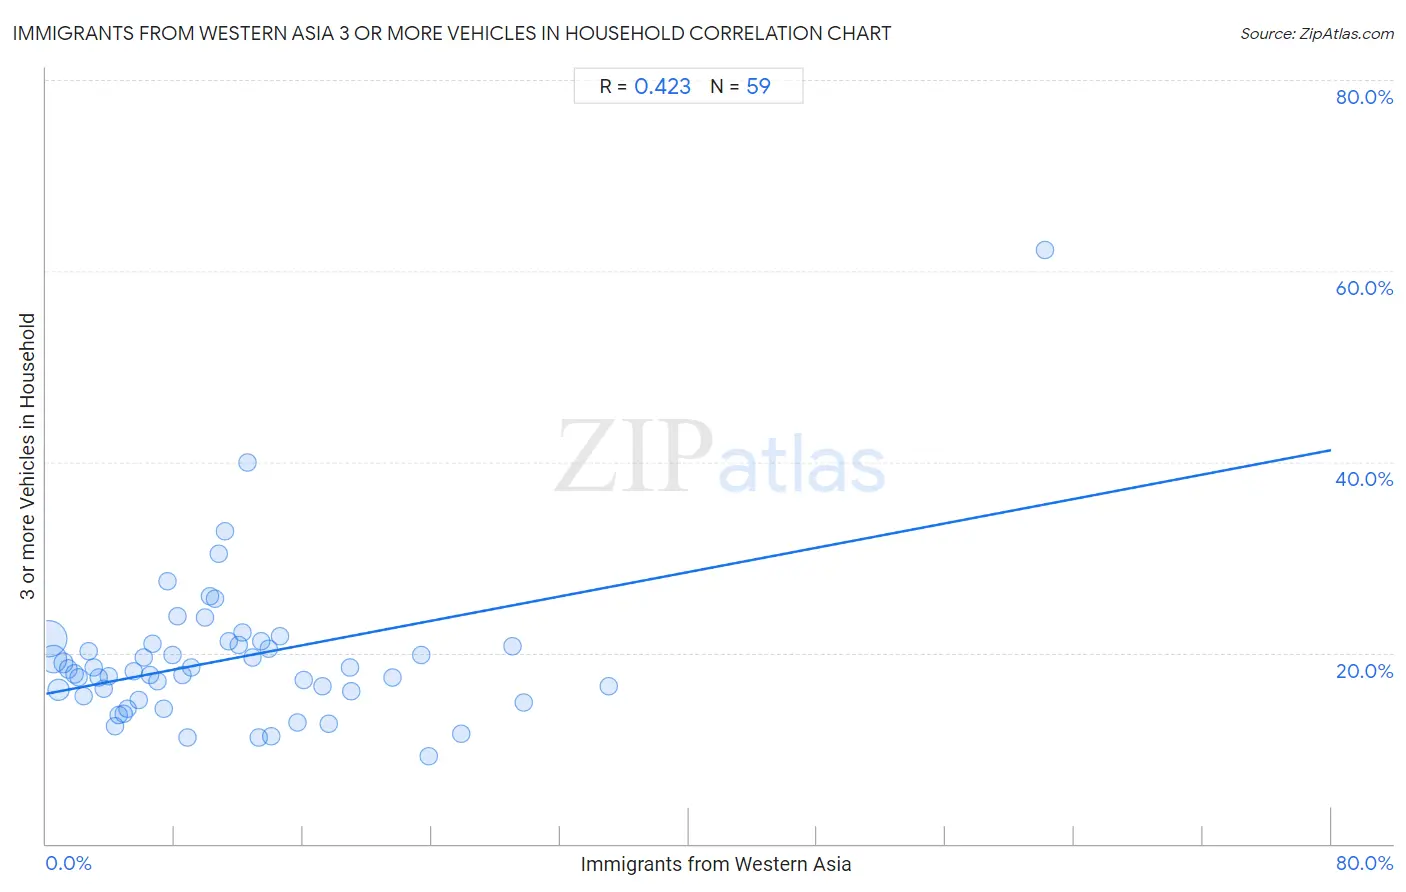
Immigrants from Western Asia 3 or more Vehicles in Household Correlation Chart
The statistical analysis conducted on geographies consisting of 404,016,930 people shows a moderate positive correlation between the proportion of Immigrants from Western Asia and percentage of households with 3 or more vehicles available in the United States with a correlation coefficient (R) of 0.423 and weighted average of 18.4%. On average, for every 1% (one percent) increase in Immigrants from Western Asia within a typical geography, there is an increase of 0.32% in percentage of households with 3 or more vehicles available.
It is essential to understand that the correlation between the percentage of Immigrants from Western Asia and percentage of households with 3 or more vehicles available does not imply a direct cause-and-effect relationship. It remains uncertain whether the presence of Immigrants from Western Asia influences an upward or downward trend in the level of percentage of households with 3 or more vehicles available within an area, or if Immigrants from Western Asia simply ended up residing in those areas with higher or lower levels of percentage of households with 3 or more vehicles available due to other factors.
Demographics Similar to Immigrants from Western Asia by 3 or more Vehicles in Household
In terms of 3 or more vehicles in household, the demographic groups most similar to Immigrants from Western Asia are Immigrants from Belgium (18.4%, a difference of 0.030%), Immigrants from Switzerland (18.4%, a difference of 0.060%), Immigrants from Uganda (18.4%, a difference of 0.090%), Honduran (18.4%, a difference of 0.11%), and Immigrants from North Macedonia (18.4%, a difference of 0.17%).
| Demographics | Rating | Rank | 3 or more Vehicles in Household |
| Immigrants from Czechoslovakia | 5.9 /100 | #223 | Tragic 18.5% |
| Immigrants from Argentina | 5.6 /100 | #224 | Tragic 18.5% |
| Immigrants from Lithuania | 5.6 /100 | #225 | Tragic 18.5% |
| Immigrants from Hungary | 5.5 /100 | #226 | Tragic 18.5% |
| Immigrants from Singapore | 5.4 /100 | #227 | Tragic 18.4% |
| Turks | 5.4 /100 | #228 | Tragic 18.4% |
| Immigrants from Switzerland | 5.0 /100 | #229 | Tragic 18.4% |
| Immigrants from Western Asia | 4.8 /100 | #230 | Tragic 18.4% |
| Immigrants from Belgium | 4.8 /100 | #231 | Tragic 18.4% |
| Immigrants from Uganda | 4.6 /100 | #232 | Tragic 18.4% |
| Hondurans | 4.6 /100 | #233 | Tragic 18.4% |
| Immigrants from North Macedonia | 4.4 /100 | #234 | Tragic 18.4% |
| Sierra Leoneans | 3.9 /100 | #235 | Tragic 18.3% |
| Immigrants from Malaysia | 3.6 /100 | #236 | Tragic 18.3% |
| Indonesians | 3.5 /100 | #237 | Tragic 18.3% |
Immigrants from Western Asia 3 or more Vehicles in Household Correlation Summary
| Measurement | Immigrants from Western Asia Data | 3 or more Vehicles in Household Data |
| Minimum | 0.14% | 9.2% |
| Maximum | 62.2% | 62.2% |
| Range | 62.0% | 52.9% |
| Mean | 11.5% | 19.4% |
| Median | 9.1% | 18.1% |
| Interquartile 25% (IQ1) | 4.5% | 15.4% |
| Interquartile 75% (IQ3) | 14.5% | 21.0% |
| Interquartile Range (IQR) | 10.0% | 5.6% |
| Standard Deviation (Sample) | 10.4% | 7.8% |
| Standard Deviation (Population) | 10.3% | 7.8% |
Correlation Details
| Immigrants from Western Asia Percentile | Sample Size | 3 or more Vehicles in Household |
[ 0.0% - 0.5% ] 0.14% | 203,257,428 | 21.5% |
[ 0.0% - 0.5% ] 0.45% | 101,967,150 | 19.3% |
[ 0.5% - 1.0% ] 0.78% | 45,263,252 | 16.2% |
[ 1.0% - 1.5% ] 1.07% | 19,580,076 | 19.0% |
[ 1.0% - 1.5% ] 1.38% | 9,333,127 | 18.3% |
[ 1.5% - 2.0% ] 1.76% | 9,994,966 | 17.8% |
[ 2.0% - 2.5% ] 2.01% | 3,574,870 | 17.4% |
[ 2.0% - 2.5% ] 2.32% | 2,342,580 | 15.4% |
[ 2.5% - 3.0% ] 2.61% | 1,522,202 | 20.1% |
[ 2.5% - 3.0% ] 2.94% | 1,422,670 | 18.4% |
[ 3.0% - 3.5% ] 3.28% | 930,858 | 17.4% |
[ 3.5% - 4.0% ] 3.56% | 593,439 | 16.2% |
[ 3.5% - 4.0% ] 3.89% | 302,075 | 17.5% |
[ 4.0% - 4.5% ] 4.25% | 496,423 | 12.3% |
[ 4.5% - 5.0% ] 4.54% | 285,910 | 13.5% |
[ 4.5% - 5.0% ] 4.81% | 173,364 | 13.6% |
[ 5.0% - 5.5% ] 5.09% | 309,688 | 14.2% |
[ 5.0% - 5.5% ] 5.43% | 101,714 | 18.1% |
[ 5.5% - 6.0% ] 5.77% | 275,172 | 15.1% |
[ 6.0% - 6.5% ] 6.08% | 188,356 | 19.5% |
[ 6.0% - 6.5% ] 6.44% | 120,665 | 17.7% |
[ 6.5% - 7.0% ] 6.60% | 149,826 | 21.0% |
[ 6.5% - 7.0% ] 6.95% | 101,986 | 17.0% |
[ 7.0% - 7.5% ] 7.35% | 102,180 | 14.2% |
[ 7.5% - 8.0% ] 7.54% | 74,447 | 27.5% |
[ 7.5% - 8.0% ] 7.84% | 39,597 | 19.7% |
[ 8.0% - 8.5% ] 8.17% | 87,848 | 23.9% |
[ 8.0% - 8.5% ] 8.49% | 11,834 | 17.7% |
[ 8.5% - 9.0% ] 8.77% | 25,278 | 11.1% |
[ 9.0% - 9.5% ] 9.06% | 49,028 | 18.4% |
[ 9.5% - 10.0% ] 9.89% | 4,580 | 23.7% |
[ 10.0% - 10.5% ] 10.23% | 52,786 | 26.0% |
[ 10.0% - 10.5% ] 10.48% | 11,399 | 25.7% |
[ 10.5% - 11.0% ] 10.77% | 22,725 | 30.3% |
[ 11.0% - 11.5% ] 11.14% | 45,937 | 32.8% |
[ 11.0% - 11.5% ] 11.36% | 61,447 | 21.2% |
[ 12.0% - 12.5% ] 12.00% | 22,029 | 20.8% |
[ 12.0% - 12.5% ] 12.23% | 33,804 | 22.2% |
[ 12.0% - 12.5% ] 12.50% | 16 | 40.0% |
[ 12.5% - 13.0% ] 12.83% | 34,921 | 19.6% |
[ 13.0% - 13.5% ] 13.24% | 43,863 | 11.1% |
[ 13.0% - 13.5% ] 13.42% | 59,775 | 21.2% |
[ 13.5% - 14.0% ] 13.84% | 105,950 | 20.4% |
[ 13.5% - 14.0% ] 13.99% | 18,630 | 11.3% |
[ 14.5% - 15.0% ] 14.53% | 146,149 | 21.7% |
[ 15.5% - 16.0% ] 15.62% | 17,165 | 12.7% |
[ 16.0% - 16.5% ] 16.05% | 62,474 | 17.2% |
[ 17.0% - 17.5% ] 17.18% | 194,512 | 16.6% |
[ 17.5% - 18.0% ] 17.59% | 50,005 | 12.6% |
[ 18.5% - 19.0% ] 18.92% | 32,294 | 18.4% |
[ 18.5% - 19.0% ] 18.99% | 22,831 | 15.9% |
[ 21.5% - 22.0% ] 21.57% | 40,392 | 17.4% |
[ 23.0% - 23.5% ] 23.38% | 151,646 | 19.8% |
[ 23.5% - 24.0% ] 23.81% | 5,526 | 9.2% |
[ 25.5% - 26.0% ] 25.87% | 35,755 | 11.5% |
[ 29.0% - 29.5% ] 29.03% | 310 | 20.7% |
[ 29.5% - 30.0% ] 29.76% | 8,919 | 14.8% |
[ 35.0% - 35.5% ] 35.02% | 53,044 | 16.5% |
[ 62.0% - 62.5% ] 62.16% | 37 | 62.2% |