Immigrants from Western Asia Wage/Income Gap

COMPARE

Immigrants from Western Asia
Race
Ancestry
AfghanAfricanAlaska NativeAlaskan AthabascanAlbanianAleutAlsatianAmericanApacheArabArapahoArgentineanArmenianAssyrian/Chaldean/SyriacAustralianAustrianBahamianBangladeshiBarbadianBasqueBelgianBelizeanBermudanBhutaneseBlackfeetBolivianBrazilianBritishBritish West IndianBulgarianBurmeseCajunCambodianCanadianCape VerdeanCarpatho RusynCelticCentral AmericanCentral American IndianCherokeeCheyenneChickasawChileanChineseChippewaChoctawColombianColvilleComancheCosta RicanCreeCreekCroatianCrowCubanCypriotCzechCzechoslovakianDanishDelawareDominicanDutchDutch West IndianEastern EuropeanEcuadorianEgyptianEnglishEstonianEthiopianEuropeanFijianFilipinoFinnishFrenchFrench American IndianFrench CanadianGermanGerman RussianGhanaianGreekGuamanian/ChamorroGuatemalanGuyaneseHaitianHmongHonduranHopiHoumaHungarianIcelanderIndian (Asian)IndonesianInupiatIranianIraqiIrishIroquoisIsraeliItalianJamaicanJapaneseJordanianKenyanKiowaKoreanLaotianLatvianLebaneseLiberianLithuanianLumbeeLuxembourgerMacedonianMalaysianMalteseMarshalleseMenomineeMexicanMexican American IndianMongolianMoroccanNative HawaiianNavajoNepaleseNew ZealanderNicaraguanNigerianNorthern EuropeanNorwegianOkinawanOsageOttawaPaiutePakistaniPalestinianPanamanianParaguayanPennsylvania GermanPeruvianPimaPolishPortuguesePotawatomiPuebloPuerto RicanPuget Sound SalishRomanianRussianSalvadoranSamoanScandinavianScotch-IrishScottishSeminoleSenegaleseSerbianShoshoneSierra LeoneanSiouxSlavicSlovakSloveneSomaliSouth AfricanSouth AmericanSouth American IndianSoviet UnionSpaniardSpanishSpanish AmericanSpanish American IndianSri LankanSubsaharan AfricanSudaneseSwedishSwissSyrianTaiwaneseThaiTlingit-HaidaTohono O'OdhamTonganTrinidadian and TobagonianTsimshianTurkishU.S. Virgin IslanderUgandanUkrainianUruguayanUteVenezuelanVietnameseWelshWest IndianYakamaYaquiYugoslavianYumanYup'ikZimbabwean
Immigration
NonimmigrantsImmigrantsAfghanistanAfricaAlbaniaArgentinaArmeniaAsiaAustraliaAustriaBahamasBangladeshBarbadosBelarusBelgiumBelizeBoliviaBosnia and HerzegovinaBrazilBulgariaBurma/MyanmarCabo VerdeCambodiaCameroonCanadaCaribbeanCentral AmericaChileChinaColombiaCongoCosta RicaCroatiaCubaCzechoslovakiaDenmarkDominicaDominican RepublicEastern AfricaEastern AsiaEastern EuropeEcuadorEgyptEl SalvadorEnglandEritreaEthiopiaEuropeFijiFranceGermanyGhanaGreeceGrenadaGuatemalaGuyanaHaitiHondurasHong KongHungaryIndiaIndonesiaIranIraqIrelandIsraelItalyJamaicaJapanJordanKazakhstanKenyaKoreaKuwaitLaosLatin AmericaLatviaLebanonLiberiaLithuaniaMalaysiaMexicoMicronesiaMiddle AfricaMoldovaMoroccoNepalNetherlandsNicaraguaNigeriaNorth AmericaNorth MacedoniaNorthern AfricaNorthern EuropeNorwayOceaniaPakistanPanamaPeruPhilippinesPolandPortugalRomaniaRussiaSaudi ArabiaScotlandSenegalSerbiaSierra LeoneSingaporeSomaliaSouth AfricaSouth AmericaSouth Central AsiaSouth Eastern AsiaSouthern EuropeSpainSri LankaSt. Vincent and the GrenadinesSudanSwedenSwitzerlandSyriaTaiwanThailandTrinidad and TobagoTurkeyUgandaUkraineUruguayUzbekistanVenezuelaVietnamWest IndiesWestern AfricaWestern AsiaWestern EuropeYemenZaireZimbabweAzores
Select to Compare
Race
Ancestry
AfghanAfricanAlaska NativeAlaskan AthabascanAlbanianAleutAlsatianAmericanApacheArabArapahoArgentineanArmenianAssyrian/Chaldean/SyriacAustralianAustrianBahamianBangladeshiBarbadianBasqueBelgianBelizeanBermudanBhutaneseBlackfeetBolivianBrazilianBritishBritish West IndianBulgarianBurmeseCajunCambodianCanadianCape VerdeanCarpatho RusynCelticCentral AmericanCentral American IndianCherokeeCheyenneChickasawChileanChineseChippewaChoctawColombianColvilleComancheCosta RicanCreeCreekCroatianCrowCubanCypriotCzechCzechoslovakianDanishDelawareDominicanDutchDutch West IndianEastern EuropeanEcuadorianEgyptianEnglishEstonianEthiopianEuropeanFijianFilipinoFinnishFrenchFrench American IndianFrench CanadianGermanGerman RussianGhanaianGreekGuamanian/ChamorroGuatemalanGuyaneseHaitianHmongHonduranHopiHoumaHungarianIcelanderIndian (Asian)IndonesianInupiatIranianIraqiIrishIroquoisIsraeliItalianJamaicanJapaneseJordanianKenyanKiowaKoreanLaotianLatvianLebaneseLiberianLithuanianLumbeeLuxembourgerMacedonianMalaysianMalteseMarshalleseMenomineeMexicanMexican American IndianMongolianMoroccanNative HawaiianNavajoNepaleseNew ZealanderNicaraguanNigerianNorthern EuropeanNorwegianOkinawanOsageOttawaPaiutePakistaniPalestinianPanamanianParaguayanPennsylvania GermanPeruvianPimaPolishPortuguesePotawatomiPuebloPuerto RicanPuget Sound SalishRomanianRussianSalvadoranSamoanScandinavianScotch-IrishScottishSeminoleSenegaleseSerbianShoshoneSierra LeoneanSiouxSlavicSlovakSloveneSomaliSouth AfricanSouth AmericanSouth American IndianSoviet UnionSpaniardSpanishSpanish AmericanSpanish American IndianSri LankanSubsaharan AfricanSudaneseSwedishSwissSyrianTaiwaneseThaiTlingit-HaidaTohono O'OdhamTonganTrinidadian and TobagonianTsimshianTurkishU.S. Virgin IslanderUgandanUkrainianUruguayanUteVenezuelanVietnameseWelshWest IndianYakamaYaquiYugoslavianYumanYup'ikZimbabwean
Immigration
NonimmigrantsImmigrantsAfghanistanAfricaAlbaniaArgentinaArmeniaAsiaAustraliaAustriaBahamasBangladeshBarbadosBelarusBelgiumBelizeBoliviaBosnia and HerzegovinaBrazilBulgariaBurma/MyanmarCabo VerdeCambodiaCameroonCanadaCaribbeanCentral AmericaChileChinaColombiaCongoCosta RicaCroatiaCubaCzechoslovakiaDenmarkDominicaDominican RepublicEastern AfricaEastern AsiaEastern EuropeEcuadorEgyptEl SalvadorEnglandEritreaEthiopiaEuropeFijiFranceGermanyGhanaGreeceGrenadaGuatemalaGuyanaHaitiHondurasHong KongHungaryIndiaIndonesiaIranIraqIrelandIsraelItalyJamaicaJapanJordanKazakhstanKenyaKoreaKuwaitLaosLatin AmericaLatviaLebanonLiberiaLithuaniaMalaysiaMexicoMicronesiaMiddle AfricaMoldovaMoroccoNepalNetherlandsNicaraguaNigeriaNorth AmericaNorth MacedoniaNorthern AfricaNorthern EuropeNorwayOceaniaPakistanPanamaPeruPhilippinesPolandPortugalRomaniaRussiaSaudi ArabiaScotlandSenegalSerbiaSierra LeoneSingaporeSomaliaSouth AfricaSouth AmericaSouth Central AsiaSouth Eastern AsiaSouthern EuropeSpainSri LankaSt. Vincent and the GrenadinesSudanSwedenSwitzerlandSyriaTaiwanThailandTrinidad and TobagoTurkeyUgandaUkraineUruguayUzbekistanVenezuelaVietnamWest IndiesWestern AfricaWestern EuropeYemenZaireZimbabweAzores
Wage/Income Gap
Income
Poverty
Unemployment
Labor Participation
Family Structure
Vehicle Availability
Education Level
Disability

Immigrants from Western Asia Wage/Income Gap
Fair

26.3%
WAGE/INCOME GAP
21.7/ 100
METRIC RATING
196th/ 347
METRIC RANK

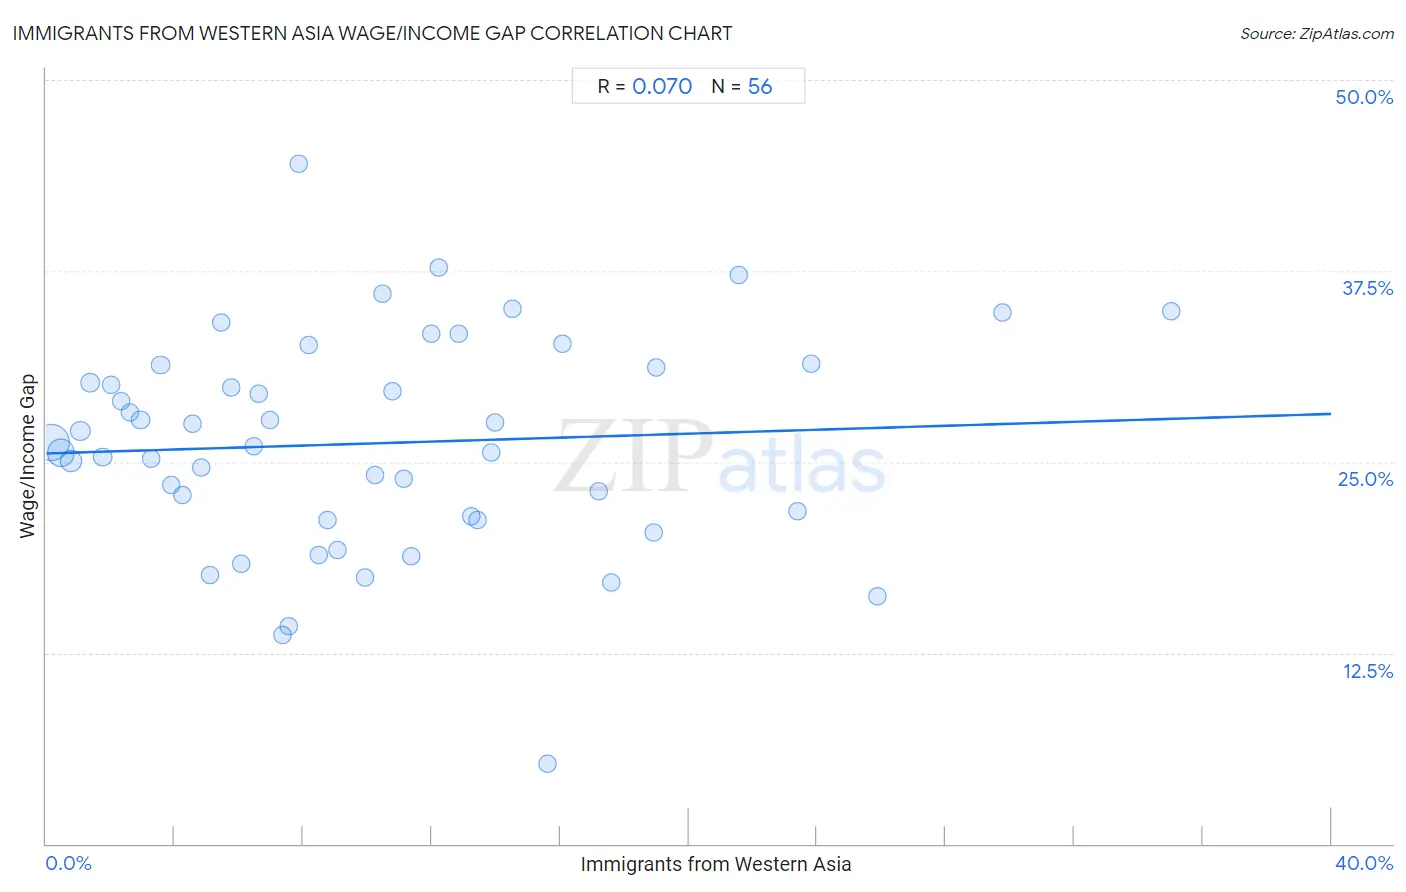
Immigrants from Western Asia Wage/Income Gap Correlation Chart

The statistical analysis conducted on geographies consisting of 404,196,693 people shows a slight positive correlation between the proportion of Immigrants from Western Asia and wage/income gap percentage in the United States with a correlation coefficient (R) of 0.070 and weighted average of 26.3%. On average, for every 1% (one percent) increase in Immigrants from Western Asia within a typical geography, there is an increase of 0.065% in wage/income gap percentage.
Immigrants from Western Asia Wage/Income Gap
It is essential to understand that the correlation between the percentage of Immigrants from Western Asia and wage/income gap percentage does not imply a direct cause-and-effect relationship. It remains uncertain whether the presence of Immigrants from Western Asia influences an upward or downward trend in the level of wage/income gap percentage within an area, or if Immigrants from Western Asia simply ended up residing in those areas with higher or lower levels of wage/income gap percentage due to other factors.

Demographics Similar to Immigrants from Western Asia by Wage/Income Gap

In terms of wage/income gap, the demographic groups most similar to Immigrants from Western Asia are Zimbabwean (26.3%, a difference of 0.010%), Venezuelan (26.3%, a difference of 0.020%), Immigrants from Malaysia (26.3%, a difference of 0.050%), Immigrants from Jordan (26.3%, a difference of 0.060%), and Chilean (26.3%, a difference of 0.060%).
DemographicsRating | RankWage/Income Gap
Immigrants from Moldova
26.6
/100
|
#189
Fair
26.2%
Immigrants from Croatia
24.8
/100
|
#190
Fair
26.2%
Immigrants from Venezuela
24.7
/100
|
#191
Fair
26.2%
Immigrants from Bulgaria
22.5
/100
|
#192
Fair
26.3%
Immigrants from Jordan
22.4
/100
|
#193
Fair
26.3%
Chileans
22.3
/100
|
#194
Fair
26.3%
Immigrants from Malaysia
22.2
/100
|
#195
Fair
26.3%
Immigrants from Western Asia
21.7
/100
|
#196
Fair
26.3%
Zimbabweans
21.6
/100
|
#197
Fair
26.3%
Venezuelans
21.5
/100
|
#198
Fair
26.3%
Dutch West Indians
21.0
/100
|
#199
Fair
26.3%
Delaware
20.9
/100
|
#200
Fair
26.3%
Immigrants from Syria
19.3
/100
|
#201
Poor
26.4%
Laotians
19.2
/100
|
#202
Poor
26.4%
Immigrants from Eastern Europe
19.2
/100
|
#203
Poor
26.4%

Immigrants from Western Asia Wage/Income Gap Correlation Summary

MeasurementImmigrants from Western Asia DataWage/Income Gap Data
Minimum0.14%5.2%
Maximum35.0%44.5%
Range34.9%39.3%
Mean10.2%26.2%
Median8.6%26.2%
Interquartile 25% (IQ1)4.4%21.3%
Interquartile 75% (IQ3)13.9%31.2%
Interquartile Range (IQR)9.5%9.9%
Standard Deviation (Sample)7.7%7.1%
Standard Deviation (Population)7.6%7.1%

Correlation Details

Immigrants from Western Asia PercentileSample SizeWage/Income Gap
[
0.0%
-
0.5%
]
0.14%
203,311,39626.3%
[
0.0%
-
0.5%
]
0.45%
102,057,98125.6%
[
0.5%
-
1.0%
]
0.78%
45,282,09025.1%
[
1.0%
-
1.5%
]
1.07%
19,611,30127.0%
[
1.0%
-
1.5%
]
1.38%
9,343,34430.2%
[
1.5%
-
2.0%
]
1.76%
9,993,21125.3%
[
2.0%
-
2.5%
]
2.01%
3,557,39830.1%
[
2.0%
-
2.5%
]
2.32%
2,351,28129.0%
[
2.5%
-
3.0%
]
2.61%
1,522,30328.2%
[
2.5%
-
3.0%
]
2.94%
1,419,59327.8%
[
3.0%
-
3.5%
]
3.28%
930,02325.2%
[
3.5%
-
4.0%
]
3.56%
591,02731.3%
[
3.5%
-
4.0%
]
3.89%
305,32223.5%
[
4.0%
-
4.5%
]
4.25%
496,91722.8%
[
4.5%
-
5.0%
]
4.54%
285,26527.5%
[
4.5%
-
5.0%
]
4.81%
173,11024.7%
[
5.0%
-
5.5%
]
5.09%
309,68817.6%
[
5.0%
-
5.5%
]
5.43%
101,18834.1%
[
5.5%
-
6.0%
]
5.77%
273,52429.8%
[
6.0%
-
6.5%
]
6.08%
187,91718.3%
[
6.0%
-
6.5%
]
6.44%
118,66526.1%
[
6.5%
-
7.0%
]
6.60%
148,15029.5%
[
6.5%
-
7.0%
]
6.95%
101,98627.8%
[
7.0%
-
7.5%
]
7.35%
102,18013.6%
[
7.5%
-
8.0%
]
7.54%
74,26514.2%
[
7.5%
-
8.0%
]
7.84%
39,30644.5%
[
8.0%
-
8.5%
]
8.17%
87,84832.7%
[
8.0%
-
8.5%
]
8.49%
11,83418.9%
[
8.5%
-
9.0%
]
8.77%
25,27821.2%
[
9.0%
-
9.5%
]
9.06%
49,02819.2%
[
9.5%
-
10.0%
]
9.91%
3,52117.4%
[
10.0%
-
10.5%
]
10.23%
52,78624.2%
[
10.0%
-
10.5%
]
10.49%
11,09136.0%
[
10.5%
-
11.0%
]
10.77%
22,43029.6%
[
11.0%
-
11.5%
]
11.14%
45,93723.9%
[
11.0%
-
11.5%
]
11.36%
61,44718.8%
[
12.0%
-
12.5%
]
12.00%
21,58733.4%
[
12.0%
-
12.5%
]
12.23%
33,17437.7%
[
12.5%
-
13.0%
]
12.83%
34,92133.4%
[
13.0%
-
13.5%
]
13.25%
43,21321.4%
[
13.0%
-
13.5%
]
13.42%
59,77521.2%
[
13.5%
-
14.0%
]
13.84%
105,72125.6%
[
13.5%
-
14.0%
]
13.99%
18,44527.6%
[
14.5%
-
15.0%
]
14.53%
146,14935.0%
[
15.5%
-
16.0%
]
15.62%
16,6795.2%
[
16.0%
-
16.5%
]
16.05%
62,47432.7%
[
17.0%
-
17.5%
]
17.18%
194,51223.1%
[
17.5%
-
18.0%
]
17.59%
50,00517.1%
[
18.5%
-
19.0%
]
18.92%
32,29420.4%
[
18.5%
-
19.0%
]
18.99%
22,83131.2%
[
21.5%
-
22.0%
]
21.57%
40,39237.3%
[
23.0%
-
23.5%
]
23.38%
151,64621.8%
[
23.5%
-
24.0%
]
23.81%
5,52631.5%
[
25.5%
-
26.0%
]
25.87%
35,75516.2%
[
29.5%
-
30.0%
]
29.76%
8,91934.8%
[
35.0%
-
35.5%
]
35.02%
53,04434.9%