Immigrants from Western Asia 4 or more Vehicles in Household
COMPARE
Immigrants from Western Asia
Select to Compare
4 or more Vehicles in Household
Immigrants from Western Asia 4 or more Vehicles in Household
5.9%
4+ VEHICLES AVAILABLE
7.8/ 100
METRIC RATING
227th/ 347
METRIC RANK
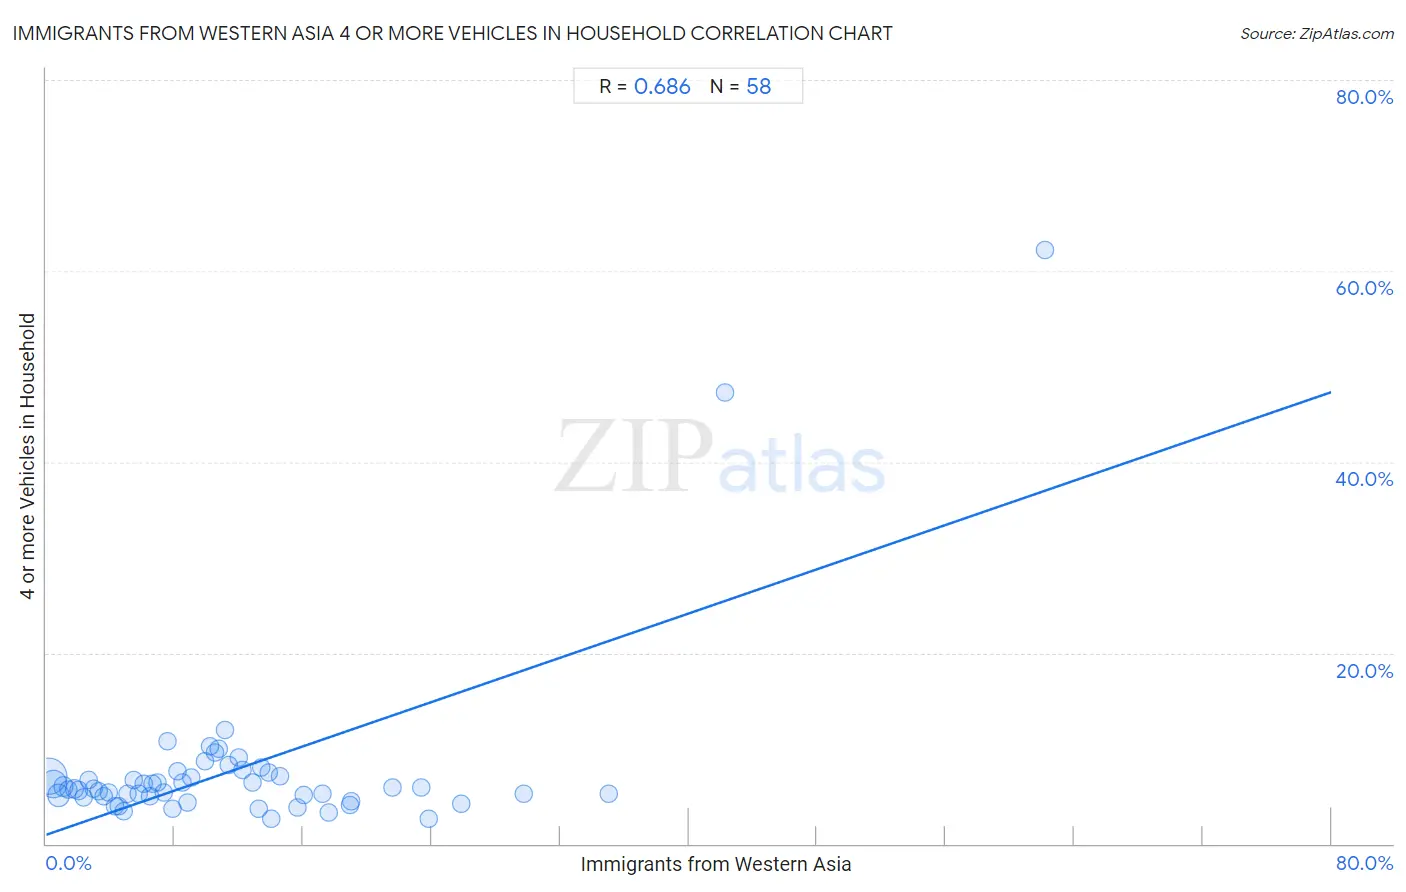
Immigrants from Western Asia 4 or more Vehicles in Household Correlation Chart
The statistical analysis conducted on geographies consisting of 402,393,776 people shows a significant positive correlation between the proportion of Immigrants from Western Asia and percentage of households with 4 or more vehicles available in the United States with a correlation coefficient (R) of 0.686 and weighted average of 5.9%. On average, for every 1% (one percent) increase in Immigrants from Western Asia within a typical geography, there is an increase of 0.58% in percentage of households with 4 or more vehicles available.
It is essential to understand that the correlation between the percentage of Immigrants from Western Asia and percentage of households with 4 or more vehicles available does not imply a direct cause-and-effect relationship. It remains uncertain whether the presence of Immigrants from Western Asia influences an upward or downward trend in the level of percentage of households with 4 or more vehicles available within an area, or if Immigrants from Western Asia simply ended up residing in those areas with higher or lower levels of percentage of households with 4 or more vehicles available due to other factors.
Demographics Similar to Immigrants from Western Asia by 4 or more Vehicles in Household
In terms of 4 or more vehicles in household, the demographic groups most similar to Immigrants from Western Asia are Immigrants from Singapore (5.9%, a difference of 0.040%), Immigrants from Uganda (5.9%, a difference of 0.090%), Eastern European (5.9%, a difference of 0.38%), Indonesian (6.0%, a difference of 0.41%), and Immigrants from Malaysia (5.9%, a difference of 0.44%).
| Demographics | Rating | Rank | 4 or more Vehicles in Household |
| Russians | 10.3 /100 | #220 | Poor 6.0% |
| Immigrants from Moldova | 9.3 /100 | #221 | Tragic 6.0% |
| Cajuns | 9.2 /100 | #222 | Tragic 6.0% |
| Immigrants from Kenya | 9.2 /100 | #223 | Tragic 6.0% |
| Cubans | 9.2 /100 | #224 | Tragic 6.0% |
| Indonesians | 8.9 /100 | #225 | Tragic 6.0% |
| Immigrants from Singapore | 7.9 /100 | #226 | Tragic 5.9% |
| Immigrants from Western Asia | 7.8 /100 | #227 | Tragic 5.9% |
| Immigrants from Uganda | 7.5 /100 | #228 | Tragic 5.9% |
| Eastern Europeans | 6.8 /100 | #229 | Tragic 5.9% |
| Immigrants from Malaysia | 6.7 /100 | #230 | Tragic 5.9% |
| Immigrants from Switzerland | 6.4 /100 | #231 | Tragic 5.9% |
| Immigrants from Argentina | 6.0 /100 | #232 | Tragic 5.9% |
| Sierra Leoneans | 6.0 /100 | #233 | Tragic 5.9% |
| Africans | 4.6 /100 | #234 | Tragic 5.8% |
Immigrants from Western Asia 4 or more Vehicles in Household Correlation Summary
| Measurement | Immigrants from Western Asia Data | 4 or more Vehicles in Household Data |
| Minimum | 0.14% | 2.6% |
| Maximum | 62.2% | 62.2% |
| Range | 62.0% | 59.5% |
| Mean | 11.7% | 7.7% |
| Median | 8.9% | 5.8% |
| Interquartile 25% (IQ1) | 4.5% | 5.0% |
| Interquartile 75% (IQ3) | 14.5% | 7.1% |
| Interquartile Range (IQR) | 10.0% | 2.1% |
| Standard Deviation (Sample) | 11.0% | 9.3% |
| Standard Deviation (Population) | 10.9% | 9.2% |
Correlation Details
| Immigrants from Western Asia Percentile | Sample Size | 4 or more Vehicles in Household |
[ 0.0% - 0.5% ] 0.14% | 202,700,037 | 7.1% |
[ 0.0% - 0.5% ] 0.45% | 101,544,996 | 6.3% |
[ 0.5% - 1.0% ] 0.78% | 45,055,495 | 5.1% |
[ 1.0% - 1.5% ] 1.07% | 19,447,526 | 6.0% |
[ 1.0% - 1.5% ] 1.38% | 9,281,239 | 5.7% |
[ 1.5% - 2.0% ] 1.76% | 9,969,799 | 5.8% |
[ 2.0% - 2.5% ] 2.01% | 3,440,385 | 5.6% |
[ 2.0% - 2.5% ] 2.32% | 2,312,009 | 4.9% |
[ 2.5% - 3.0% ] 2.61% | 1,495,040 | 6.7% |
[ 2.5% - 3.0% ] 2.94% | 1,414,188 | 5.8% |
[ 3.0% - 3.5% ] 3.28% | 930,858 | 5.5% |
[ 3.5% - 4.0% ] 3.56% | 593,439 | 5.0% |
[ 3.5% - 4.0% ] 3.89% | 300,108 | 5.3% |
[ 4.0% - 4.5% ] 4.25% | 479,455 | 4.0% |
[ 4.5% - 5.0% ] 4.54% | 285,910 | 4.0% |
[ 4.5% - 5.0% ] 4.81% | 172,830 | 3.4% |
[ 5.0% - 5.5% ] 5.09% | 309,688 | 5.3% |
[ 5.0% - 5.5% ] 5.43% | 101,188 | 6.7% |
[ 5.5% - 6.0% ] 5.77% | 273,524 | 5.3% |
[ 6.0% - 6.5% ] 6.08% | 187,917 | 6.3% |
[ 6.0% - 6.5% ] 6.44% | 120,665 | 5.0% |
[ 6.5% - 7.0% ] 6.60% | 149,826 | 6.3% |
[ 6.5% - 7.0% ] 6.95% | 101,986 | 6.4% |
[ 7.0% - 7.5% ] 7.35% | 102,180 | 5.3% |
[ 7.5% - 8.0% ] 7.54% | 74,265 | 10.7% |
[ 7.5% - 8.0% ] 7.84% | 39,306 | 3.7% |
[ 8.0% - 8.5% ] 8.17% | 87,848 | 7.6% |
[ 8.0% - 8.5% ] 8.48% | 11,326 | 6.5% |
[ 8.5% - 9.0% ] 8.77% | 25,278 | 4.3% |
[ 9.0% - 9.5% ] 9.06% | 49,028 | 6.9% |
[ 9.5% - 10.0% ] 9.88% | 2,176 | 8.6% |
[ 10.0% - 10.5% ] 10.23% | 52,786 | 10.3% |
[ 10.0% - 10.5% ] 10.48% | 11,399 | 9.6% |
[ 10.5% - 11.0% ] 10.77% | 22,725 | 10.0% |
[ 11.0% - 11.5% ] 11.14% | 45,937 | 11.9% |
[ 11.0% - 11.5% ] 11.36% | 61,447 | 8.2% |
[ 12.0% - 12.5% ] 12.00% | 22,029 | 9.1% |
[ 12.0% - 12.5% ] 12.23% | 33,804 | 7.7% |
[ 12.5% - 13.0% ] 12.83% | 34,921 | 6.4% |
[ 13.0% - 13.5% ] 13.24% | 43,863 | 3.6% |
[ 13.0% - 13.5% ] 13.42% | 59,775 | 8.0% |
[ 13.5% - 14.0% ] 13.84% | 105,721 | 7.5% |
[ 13.5% - 14.0% ] 13.99% | 18,445 | 2.6% |
[ 14.5% - 15.0% ] 14.53% | 146,149 | 7.1% |
[ 15.5% - 16.0% ] 15.62% | 17,165 | 3.8% |
[ 16.0% - 16.5% ] 16.05% | 62,474 | 5.1% |
[ 17.0% - 17.5% ] 17.18% | 194,512 | 5.3% |
[ 17.5% - 18.0% ] 17.59% | 50,005 | 3.2% |
[ 18.5% - 19.0% ] 18.92% | 32,294 | 4.0% |
[ 18.5% - 19.0% ] 18.99% | 22,831 | 4.5% |
[ 21.5% - 22.0% ] 21.57% | 40,392 | 5.9% |
[ 23.0% - 23.5% ] 23.38% | 151,646 | 5.9% |
[ 23.5% - 24.0% ] 23.81% | 5,526 | 2.7% |
[ 25.5% - 26.0% ] 25.87% | 35,755 | 4.2% |
[ 29.5% - 30.0% ] 29.76% | 8,919 | 5.3% |
[ 35.0% - 35.5% ] 35.02% | 53,044 | 5.3% |
[ 42.0% - 42.5% ] 42.27% | 660 | 47.3% |
[ 62.0% - 62.5% ] 62.16% | 37 | 62.2% |