Immigrants from Thailand Self-Care Disability

COMPARE

Immigrants from Thailand
Race
Ancestry
AfghanAfricanAlaska NativeAlaskan AthabascanAlbanianAleutAlsatianAmericanApacheArabArapahoArgentineanArmenianAssyrian/Chaldean/SyriacAustralianAustrianBahamianBangladeshiBarbadianBasqueBelgianBelizeanBermudanBhutaneseBlackfeetBolivianBrazilianBritishBritish West IndianBulgarianBurmeseCajunCambodianCanadianCape VerdeanCarpatho RusynCelticCentral AmericanCentral American IndianCherokeeCheyenneChickasawChileanChineseChippewaChoctawColombianColvilleComancheCosta RicanCreeCreekCroatianCrowCubanCypriotCzechCzechoslovakianDanishDelawareDominicanDutchDutch West IndianEastern EuropeanEcuadorianEgyptianEnglishEstonianEthiopianEuropeanFijianFilipinoFinnishFrenchFrench American IndianFrench CanadianGermanGerman RussianGhanaianGreekGuamanian/ChamorroGuatemalanGuyaneseHaitianHmongHonduranHopiHoumaHungarianIcelanderIndian (Asian)IndonesianInupiatIranianIraqiIrishIroquoisIsraeliItalianJamaicanJapaneseJordanianKenyanKiowaKoreanLaotianLatvianLebaneseLiberianLithuanianLumbeeLuxembourgerMacedonianMalaysianMalteseMarshalleseMenomineeMexicanMexican American IndianMongolianMoroccanNative HawaiianNavajoNepaleseNew ZealanderNicaraguanNigerianNorthern EuropeanNorwegianOkinawanOsageOttawaPaiutePakistaniPalestinianPanamanianParaguayanPennsylvania GermanPeruvianPimaPolishPortuguesePotawatomiPuebloPuerto RicanPuget Sound SalishRomanianRussianSalvadoranSamoanScandinavianScotch-IrishScottishSeminoleSenegaleseSerbianShoshoneSierra LeoneanSiouxSlavicSlovakSloveneSomaliSouth AfricanSouth AmericanSouth American IndianSoviet UnionSpaniardSpanishSpanish AmericanSpanish American IndianSri LankanSubsaharan AfricanSudaneseSwedishSwissSyrianTaiwaneseThaiTlingit-HaidaTohono O'OdhamTonganTrinidadian and TobagonianTsimshianTurkishU.S. Virgin IslanderUgandanUkrainianUruguayanUteVenezuelanVietnameseWelshWest IndianYakamaYaquiYugoslavianYumanYup'ikZimbabwean
Immigration
NonimmigrantsImmigrantsAfghanistanAfricaAlbaniaArgentinaArmeniaAsiaAustraliaAustriaBahamasBangladeshBarbadosBelarusBelgiumBelizeBoliviaBosnia and HerzegovinaBrazilBulgariaBurma/MyanmarCabo VerdeCambodiaCameroonCanadaCaribbeanCentral AmericaChileChinaColombiaCongoCosta RicaCroatiaCubaCzechoslovakiaDenmarkDominicaDominican RepublicEastern AfricaEastern AsiaEastern EuropeEcuadorEgyptEl SalvadorEnglandEritreaEthiopiaEuropeFijiFranceGermanyGhanaGreeceGrenadaGuatemalaGuyanaHaitiHondurasHong KongHungaryIndiaIndonesiaIranIraqIrelandIsraelItalyJamaicaJapanJordanKazakhstanKenyaKoreaKuwaitLaosLatin AmericaLatviaLebanonLiberiaLithuaniaMalaysiaMexicoMicronesiaMiddle AfricaMoldovaMoroccoNepalNetherlandsNicaraguaNigeriaNorth AmericaNorth MacedoniaNorthern AfricaNorthern EuropeNorwayOceaniaPakistanPanamaPeruPhilippinesPolandPortugalRomaniaRussiaSaudi ArabiaScotlandSenegalSerbiaSierra LeoneSingaporeSomaliaSouth AfricaSouth AmericaSouth Central AsiaSouth Eastern AsiaSouthern EuropeSpainSri LankaSt. Vincent and the GrenadinesSudanSwedenSwitzerlandSyriaTaiwanThailandTrinidad and TobagoTurkeyUgandaUkraineUruguayUzbekistanVenezuelaVietnamWest IndiesWestern AfricaWestern AsiaWestern EuropeYemenZaireZimbabweAzores
Select to Compare
Race
Ancestry
AfghanAfricanAlaska NativeAlaskan AthabascanAlbanianAleutAlsatianAmericanApacheArabArapahoArgentineanArmenianAssyrian/Chaldean/SyriacAustralianAustrianBahamianBangladeshiBarbadianBasqueBelgianBelizeanBermudanBhutaneseBlackfeetBolivianBrazilianBritishBritish West IndianBulgarianBurmeseCajunCambodianCanadianCape VerdeanCarpatho RusynCelticCentral AmericanCentral American IndianCherokeeCheyenneChickasawChileanChineseChippewaChoctawColombianColvilleComancheCosta RicanCreeCreekCroatianCrowCubanCypriotCzechCzechoslovakianDanishDelawareDominicanDutchDutch West IndianEastern EuropeanEcuadorianEgyptianEnglishEstonianEthiopianEuropeanFijianFilipinoFinnishFrenchFrench American IndianFrench CanadianGermanGerman RussianGhanaianGreekGuamanian/ChamorroGuatemalanGuyaneseHaitianHmongHonduranHopiHoumaHungarianIcelanderIndian (Asian)IndonesianInupiatIranianIraqiIrishIroquoisIsraeliItalianJamaicanJapaneseJordanianKenyanKiowaKoreanLaotianLatvianLebaneseLiberianLithuanianLumbeeLuxembourgerMacedonianMalaysianMalteseMarshalleseMenomineeMexicanMexican American IndianMongolianMoroccanNative HawaiianNavajoNepaleseNew ZealanderNicaraguanNigerianNorthern EuropeanNorwegianOkinawanOsageOttawaPaiutePakistaniPalestinianPanamanianParaguayanPennsylvania GermanPeruvianPimaPolishPortuguesePotawatomiPuebloPuerto RicanPuget Sound SalishRomanianRussianSalvadoranSamoanScandinavianScotch-IrishScottishSeminoleSenegaleseSerbianShoshoneSierra LeoneanSiouxSlavicSlovakSloveneSomaliSouth AfricanSouth AmericanSouth American IndianSoviet UnionSpaniardSpanishSpanish AmericanSpanish American IndianSri LankanSubsaharan AfricanSudaneseSwedishSwissSyrianTaiwaneseThaiTlingit-HaidaTohono O'OdhamTonganTrinidadian and TobagonianTsimshianTurkishU.S. Virgin IslanderUgandanUkrainianUruguayanUteVenezuelanVietnameseWelshWest IndianYakamaYaquiYugoslavianYumanYup'ikZimbabwean
Immigration
NonimmigrantsImmigrantsAfghanistanAfricaAlbaniaArgentinaArmeniaAsiaAustraliaAustriaBahamasBangladeshBarbadosBelarusBelgiumBelizeBoliviaBosnia and HerzegovinaBrazilBulgariaBurma/MyanmarCabo VerdeCambodiaCameroonCanadaCaribbeanCentral AmericaChileChinaColombiaCongoCosta RicaCroatiaCubaCzechoslovakiaDenmarkDominicaDominican RepublicEastern AfricaEastern AsiaEastern EuropeEcuadorEgyptEl SalvadorEnglandEritreaEthiopiaEuropeFijiFranceGermanyGhanaGreeceGrenadaGuatemalaGuyanaHaitiHondurasHong KongHungaryIndiaIndonesiaIranIraqIrelandIsraelItalyJamaicaJapanJordanKazakhstanKenyaKoreaKuwaitLaosLatin AmericaLatviaLebanonLiberiaLithuaniaMalaysiaMexicoMicronesiaMiddle AfricaMoldovaMoroccoNepalNetherlandsNicaraguaNigeriaNorth AmericaNorth MacedoniaNorthern AfricaNorthern EuropeNorwayOceaniaPakistanPanamaPeruPhilippinesPolandPortugalRomaniaRussiaSaudi ArabiaScotlandSenegalSerbiaSierra LeoneSingaporeSomaliaSouth AfricaSouth AmericaSouth Central AsiaSouth Eastern AsiaSouthern EuropeSpainSri LankaSt. Vincent and the GrenadinesSudanSwedenSwitzerlandSyriaTaiwanTrinidad and TobagoTurkeyUgandaUkraineUruguayUzbekistanVenezuelaVietnamWest IndiesWestern AfricaWestern AsiaWestern EuropeYemenZaireZimbabweAzores
Self-Care Disability
Income
Poverty
Unemployment
Labor Participation
Family Structure
Vehicle Availability
Education Level
Disability

Immigrants from Thailand Self-Care Disability
Tragic

2.6%
SELF-CARE DISABILITY
4.5/ 100
METRIC RATING
215th/ 347
METRIC RANK

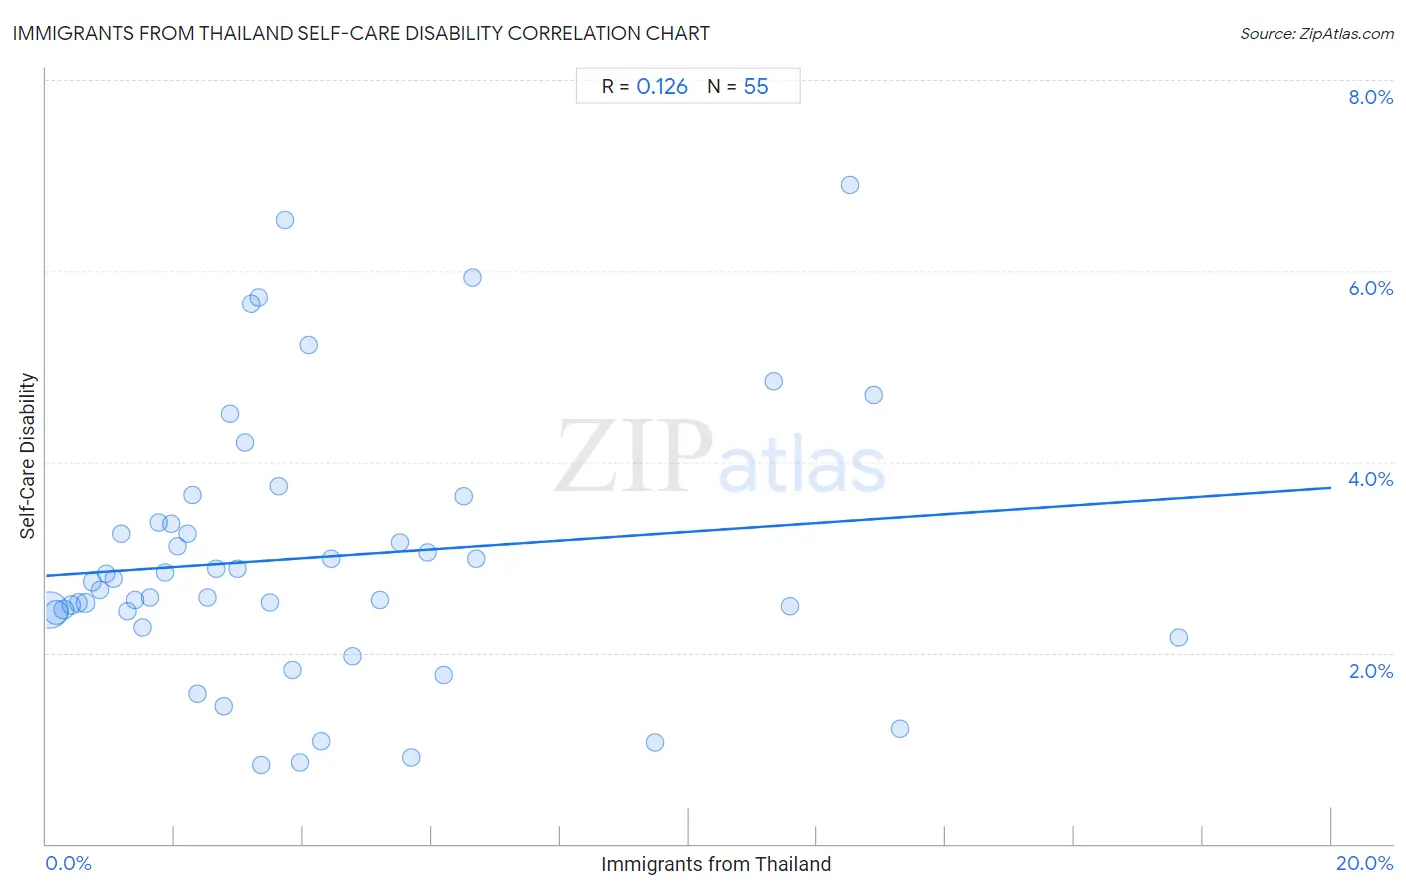
Immigrants from Thailand Self-Care Disability Correlation Chart

The statistical analysis conducted on geographies consisting of 316,791,227 people shows a poor positive correlation between the proportion of Immigrants from Thailand and percentage of population with self-care disability in the United States with a correlation coefficient (R) of 0.126 and weighted average of 2.6%. On average, for every 1% (one percent) increase in Immigrants from Thailand within a typical geography, there is an increase of 0.046% in percentage of population with self-care disability.
Immigrants from Thailand Self-Care Disability
It is essential to understand that the correlation between the percentage of Immigrants from Thailand and percentage of population with self-care disability does not imply a direct cause-and-effect relationship. It remains uncertain whether the presence of Immigrants from Thailand influences an upward or downward trend in the level of percentage of population with self-care disability within an area, or if Immigrants from Thailand simply ended up residing in those areas with higher or lower levels of percentage of population with self-care disability due to other factors.

Demographics Similar to Immigrants from Thailand by Self-Care Disability

In terms of self-care disability, the demographic groups most similar to Immigrants from Thailand are White/Caucasian (2.6%, a difference of 0.020%), Immigrants from Honduras (2.6%, a difference of 0.040%), Celtic (2.6%, a difference of 0.040%), Ecuadorian (2.6%, a difference of 0.050%), and Scotch-Irish (2.6%, a difference of 0.11%).
DemographicsRating | RankSelf-Care Disability
Central Americans
8.7
/100
|
#208
Tragic
2.5%
Malaysians
7.7
/100
|
#209
Tragic
2.5%
Panamanians
6.4
/100
|
#210
Tragic
2.5%
Native Hawaiians
5.1
/100
|
#211
Tragic
2.6%
Samoans
5.1
/100
|
#212
Tragic
2.6%
Ecuadorians
4.7
/100
|
#213
Tragic
2.6%
Immigrants from Honduras
4.7
/100
|
#214
Tragic
2.6%
Immigrants from Thailand
4.5
/100
|
#215
Tragic
2.6%
Whites/Caucasians
4.4
/100
|
#216
Tragic
2.6%
Celtics
4.4
/100
|
#217
Tragic
2.6%
Scotch-Irish
4.1
/100
|
#218
Tragic
2.6%
Immigrants from Moldova
4.0
/100
|
#219
Tragic
2.6%
Sub-Saharan Africans
4.0
/100
|
#220
Tragic
2.6%
Hondurans
3.8
/100
|
#221
Tragic
2.6%
Spaniards
3.8
/100
|
#222
Tragic
2.6%

Immigrants from Thailand Self-Care Disability Correlation Summary

MeasurementImmigrants from Thailand DataSelf-Care Disability Data
Minimum0.054%0.83%
Maximum17.6%6.9%
Range17.6%6.1%
Mean4.1%3.0%
Median3.1%2.7%
Interquartile 25% (IQ1)1.5%2.4%
Interquartile 75% (IQ3)5.5%3.4%
Interquartile Range (IQR)4.0%0.94%
Standard Deviation (Sample)3.8%1.4%
Standard Deviation (Population)3.8%1.4%

Correlation Details

Immigrants from Thailand PercentileSample SizeSelf-Care Disability
[
0.0%
-
0.5%
]
0.054%
196,929,6602.4%
[
0.0%
-
0.5%
]
0.16%
66,493,3912.4%
[
0.0%
-
0.5%
]
0.27%
23,640,3802.5%
[
0.0%
-
0.5%
]
0.38%
11,950,6512.5%
[
0.0%
-
0.5%
]
0.50%
6,066,1802.5%
[
0.5%
-
1.0%
]
0.61%
3,118,3822.5%
[
0.5%
-
1.0%
]
0.72%
2,372,0402.7%
[
0.5%
-
1.0%
]
0.83%
1,144,4252.7%
[
0.5%
-
1.0%
]
0.94%
680,8632.8%
[
1.0%
-
1.5%
]
1.06%
831,3332.8%
[
1.0%
-
1.5%
]
1.16%
473,8273.2%
[
1.0%
-
1.5%
]
1.27%
354,9422.4%
[
1.0%
-
1.5%
]
1.39%
521,9332.6%
[
1.5%
-
2.0%
]
1.51%
439,2072.3%
[
1.5%
-
2.0%
]
1.61%
197,5232.6%
[
1.5%
-
2.0%
]
1.76%
245,1613.4%
[
1.5%
-
2.0%
]
1.84%
107,3752.8%
[
1.5%
-
2.0%
]
1.95%
76,7543.4%
[
2.0%
-
2.5%
]
2.04%
164,3753.1%
[
2.0%
-
2.5%
]
2.19%
124,1373.3%
[
2.0%
-
2.5%
]
2.27%
87,4263.7%
[
2.0%
-
2.5%
]
2.35%
18,7351.6%
[
2.5%
-
3.0%
]
2.52%
17,9912.6%
[
2.5%
-
3.0%
]
2.65%
317,7332.9%
[
2.5%
-
3.0%
]
2.75%
23,5021.4%
[
2.5%
-
3.0%
]
2.85%
46,5164.5%
[
2.5%
-
3.0%
]
2.97%
61,5692.9%
[
3.0%
-
3.5%
]
3.09%
44,3094.2%
[
3.0%
-
3.5%
]
3.18%
1,4145.7%
[
3.0%
-
3.5%
]
3.30%
15,9895.7%
[
3.0%
-
3.5%
]
3.34%
1,9160.83%
[
3.0%
-
3.5%
]
3.49%
85,4782.5%
[
3.5%
-
4.0%
]
3.63%
17,6813.7%
[
3.5%
-
4.0%
]
3.71%
6,0656.5%
[
3.5%
-
4.0%
]
3.83%
3,4961.8%
[
3.5%
-
4.0%
]
3.95%
3800.85%
[
4.0%
-
4.5%
]
4.08%
8345.2%
[
4.0%
-
4.5%
]
4.27%
4681.1%
[
4.0%
-
4.5%
]
4.44%
5403.0%
[
4.5%
-
5.0%
]
4.76%
9872.0%
[
5.0%
-
5.5%
]
5.19%
2892.6%
[
5.5%
-
6.0%
]
5.51%
3993.1%
[
5.5%
-
6.0%
]
5.69%
8790.90%
[
5.5%
-
6.0%
]
5.93%
58,9593.1%
[
6.0%
-
6.5%
]
6.19%
9211.8%
[
6.5%
-
7.0%
]
6.51%
1,0453.6%
[
6.5%
-
7.0%
]
6.63%
19,6135.9%
[
6.5%
-
7.0%
]
6.70%
19,5013.0%
[
9.0%
-
9.5%
]
9.47%
1,0351.1%
[
11.0%
-
11.5%
]
11.33%
3094.8%
[
11.5%
-
12.0%
]
11.57%
1,1322.5%
[
12.0%
-
12.5%
]
12.50%
326.9%
[
12.5%
-
13.0%
]
12.87%
4044.7%
[
13.0%
-
13.5%
]
13.28%
7381.2%
[
17.5%
-
18.0%
]
17.62%
4032.2%