Immigrants from Thailand Wage/Income Gap

COMPARE

Immigrants from Thailand
Race
Ancestry
AfghanAfricanAlaska NativeAlaskan AthabascanAlbanianAleutAlsatianAmericanApacheArabArapahoArgentineanArmenianAssyrian/Chaldean/SyriacAustralianAustrianBahamianBangladeshiBarbadianBasqueBelgianBelizeanBermudanBhutaneseBlackfeetBolivianBrazilianBritishBritish West IndianBulgarianBurmeseCajunCambodianCanadianCape VerdeanCarpatho RusynCelticCentral AmericanCentral American IndianCherokeeCheyenneChickasawChileanChineseChippewaChoctawColombianColvilleComancheCosta RicanCreeCreekCroatianCrowCubanCypriotCzechCzechoslovakianDanishDelawareDominicanDutchDutch West IndianEastern EuropeanEcuadorianEgyptianEnglishEstonianEthiopianEuropeanFijianFilipinoFinnishFrenchFrench American IndianFrench CanadianGermanGerman RussianGhanaianGreekGuamanian/ChamorroGuatemalanGuyaneseHaitianHmongHonduranHopiHoumaHungarianIcelanderIndian (Asian)IndonesianInupiatIranianIraqiIrishIroquoisIsraeliItalianJamaicanJapaneseJordanianKenyanKiowaKoreanLaotianLatvianLebaneseLiberianLithuanianLumbeeLuxembourgerMacedonianMalaysianMalteseMarshalleseMenomineeMexicanMexican American IndianMongolianMoroccanNative HawaiianNavajoNepaleseNew ZealanderNicaraguanNigerianNorthern EuropeanNorwegianOkinawanOsageOttawaPaiutePakistaniPalestinianPanamanianParaguayanPennsylvania GermanPeruvianPimaPolishPortuguesePotawatomiPuebloPuerto RicanPuget Sound SalishRomanianRussianSalvadoranSamoanScandinavianScotch-IrishScottishSeminoleSenegaleseSerbianShoshoneSierra LeoneanSiouxSlavicSlovakSloveneSomaliSouth AfricanSouth AmericanSouth American IndianSoviet UnionSpaniardSpanishSpanish AmericanSpanish American IndianSri LankanSubsaharan AfricanSudaneseSwedishSwissSyrianTaiwaneseThaiTlingit-HaidaTohono O'OdhamTonganTrinidadian and TobagonianTsimshianTurkishU.S. Virgin IslanderUgandanUkrainianUruguayanUteVenezuelanVietnameseWelshWest IndianYakamaYaquiYugoslavianYumanYup'ikZimbabwean
Immigration
NonimmigrantsImmigrantsAfghanistanAfricaAlbaniaArgentinaArmeniaAsiaAustraliaAustriaBahamasBangladeshBarbadosBelarusBelgiumBelizeBoliviaBosnia and HerzegovinaBrazilBulgariaBurma/MyanmarCabo VerdeCambodiaCameroonCanadaCaribbeanCentral AmericaChileChinaColombiaCongoCosta RicaCroatiaCubaCzechoslovakiaDenmarkDominicaDominican RepublicEastern AfricaEastern AsiaEastern EuropeEcuadorEgyptEl SalvadorEnglandEritreaEthiopiaEuropeFijiFranceGermanyGhanaGreeceGrenadaGuatemalaGuyanaHaitiHondurasHong KongHungaryIndiaIndonesiaIranIraqIrelandIsraelItalyJamaicaJapanJordanKazakhstanKenyaKoreaKuwaitLaosLatin AmericaLatviaLebanonLiberiaLithuaniaMalaysiaMexicoMicronesiaMiddle AfricaMoldovaMoroccoNepalNetherlandsNicaraguaNigeriaNorth AmericaNorth MacedoniaNorthern AfricaNorthern EuropeNorwayOceaniaPakistanPanamaPeruPhilippinesPolandPortugalRomaniaRussiaSaudi ArabiaScotlandSenegalSerbiaSierra LeoneSingaporeSomaliaSouth AfricaSouth AmericaSouth Central AsiaSouth Eastern AsiaSouthern EuropeSpainSri LankaSt. Vincent and the GrenadinesSudanSwedenSwitzerlandSyriaTaiwanThailandTrinidad and TobagoTurkeyUgandaUkraineUruguayUzbekistanVenezuelaVietnamWest IndiesWestern AfricaWestern AsiaWestern EuropeYemenZaireZimbabweAzores
Select to Compare
Race
Ancestry
AfghanAfricanAlaska NativeAlaskan AthabascanAlbanianAleutAlsatianAmericanApacheArabArapahoArgentineanArmenianAssyrian/Chaldean/SyriacAustralianAustrianBahamianBangladeshiBarbadianBasqueBelgianBelizeanBermudanBhutaneseBlackfeetBolivianBrazilianBritishBritish West IndianBulgarianBurmeseCajunCambodianCanadianCape VerdeanCarpatho RusynCelticCentral AmericanCentral American IndianCherokeeCheyenneChickasawChileanChineseChippewaChoctawColombianColvilleComancheCosta RicanCreeCreekCroatianCrowCubanCypriotCzechCzechoslovakianDanishDelawareDominicanDutchDutch West IndianEastern EuropeanEcuadorianEgyptianEnglishEstonianEthiopianEuropeanFijianFilipinoFinnishFrenchFrench American IndianFrench CanadianGermanGerman RussianGhanaianGreekGuamanian/ChamorroGuatemalanGuyaneseHaitianHmongHonduranHopiHoumaHungarianIcelanderIndian (Asian)IndonesianInupiatIranianIraqiIrishIroquoisIsraeliItalianJamaicanJapaneseJordanianKenyanKiowaKoreanLaotianLatvianLebaneseLiberianLithuanianLumbeeLuxembourgerMacedonianMalaysianMalteseMarshalleseMenomineeMexicanMexican American IndianMongolianMoroccanNative HawaiianNavajoNepaleseNew ZealanderNicaraguanNigerianNorthern EuropeanNorwegianOkinawanOsageOttawaPaiutePakistaniPalestinianPanamanianParaguayanPennsylvania GermanPeruvianPimaPolishPortuguesePotawatomiPuebloPuerto RicanPuget Sound SalishRomanianRussianSalvadoranSamoanScandinavianScotch-IrishScottishSeminoleSenegaleseSerbianShoshoneSierra LeoneanSiouxSlavicSlovakSloveneSomaliSouth AfricanSouth AmericanSouth American IndianSoviet UnionSpaniardSpanishSpanish AmericanSpanish American IndianSri LankanSubsaharan AfricanSudaneseSwedishSwissSyrianTaiwaneseThaiTlingit-HaidaTohono O'OdhamTonganTrinidadian and TobagonianTsimshianTurkishU.S. Virgin IslanderUgandanUkrainianUruguayanUteVenezuelanVietnameseWelshWest IndianYakamaYaquiYugoslavianYumanYup'ikZimbabwean
Immigration
NonimmigrantsImmigrantsAfghanistanAfricaAlbaniaArgentinaArmeniaAsiaAustraliaAustriaBahamasBangladeshBarbadosBelarusBelgiumBelizeBoliviaBosnia and HerzegovinaBrazilBulgariaBurma/MyanmarCabo VerdeCambodiaCameroonCanadaCaribbeanCentral AmericaChileChinaColombiaCongoCosta RicaCroatiaCubaCzechoslovakiaDenmarkDominicaDominican RepublicEastern AfricaEastern AsiaEastern EuropeEcuadorEgyptEl SalvadorEnglandEritreaEthiopiaEuropeFijiFranceGermanyGhanaGreeceGrenadaGuatemalaGuyanaHaitiHondurasHong KongHungaryIndiaIndonesiaIranIraqIrelandIsraelItalyJamaicaJapanJordanKazakhstanKenyaKoreaKuwaitLaosLatin AmericaLatviaLebanonLiberiaLithuaniaMalaysiaMexicoMicronesiaMiddle AfricaMoldovaMoroccoNepalNetherlandsNicaraguaNigeriaNorth AmericaNorth MacedoniaNorthern AfricaNorthern EuropeNorwayOceaniaPakistanPanamaPeruPhilippinesPolandPortugalRomaniaRussiaSaudi ArabiaScotlandSenegalSerbiaSierra LeoneSingaporeSomaliaSouth AfricaSouth AmericaSouth Central AsiaSouth Eastern AsiaSouthern EuropeSpainSri LankaSt. Vincent and the GrenadinesSudanSwedenSwitzerlandSyriaTaiwanTrinidad and TobagoTurkeyUgandaUkraineUruguayUzbekistanVenezuelaVietnamWest IndiesWestern AfricaWestern AsiaWestern EuropeYemenZaireZimbabweAzores
Wage/Income Gap
Income
Poverty
Unemployment
Labor Participation
Family Structure
Vehicle Availability
Education Level
Disability

Immigrants from Thailand Wage/Income Gap
Exceptional

24.5%
WAGE/INCOME GAP
94.9/ 100
METRIC RATING
121st/ 347
METRIC RANK

Immigrants from Thailand Wage/Income Gap Correlation Chart

The statistical analysis conducted on geographies consisting of 316,913,718 people shows a weak positive correlation between the proportion of Immigrants from Thailand and wage/income gap percentage in the United States with a correlation coefficient (R) of 0.224 and weighted average of 24.5%. On average, for every 1% (one percent) increase in Immigrants from Thailand within a typical geography, there is an increase of 0.97% in wage/income gap percentage.
Immigrants from Thailand Wage/Income Gap
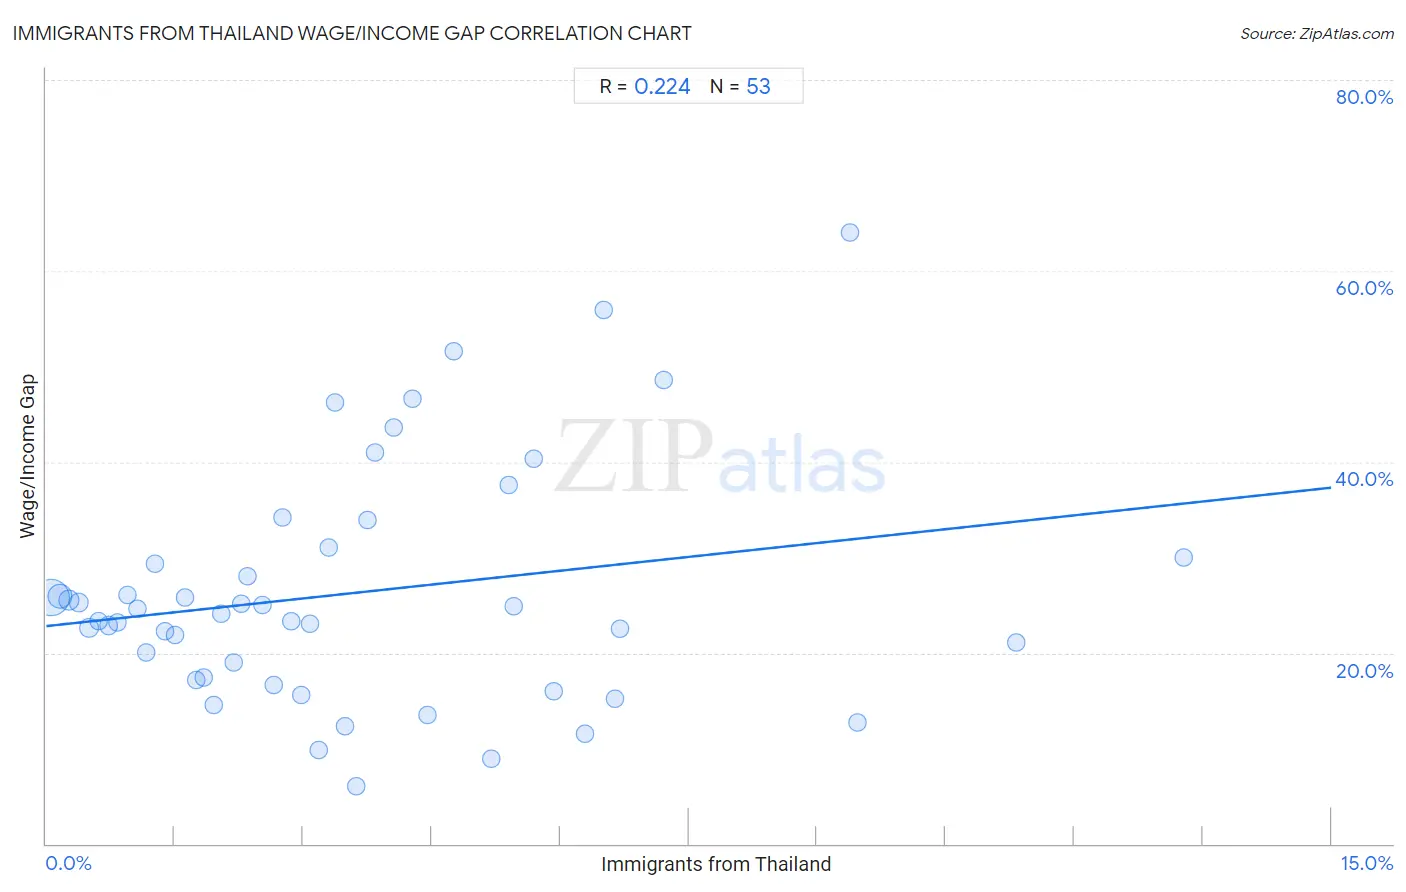
It is essential to understand that the correlation between the percentage of Immigrants from Thailand and wage/income gap percentage does not imply a direct cause-and-effect relationship. It remains uncertain whether the presence of Immigrants from Thailand influences an upward or downward trend in the level of wage/income gap percentage within an area, or if Immigrants from Thailand simply ended up residing in those areas with higher or lower levels of wage/income gap percentage due to other factors.

Demographics Similar to Immigrants from Thailand by Wage/Income Gap

In terms of wage/income gap, the demographic groups most similar to Immigrants from Thailand are Apache (24.5%, a difference of 0.050%), Native/Alaskan (24.6%, a difference of 0.12%), Cree (24.5%, a difference of 0.27%), Immigrants from South America (24.6%, a difference of 0.33%), and Kenyan (24.5%, a difference of 0.34%).
DemographicsRating | RankWage/Income Gap
Panamanians
96.5
/100
|
#114
Exceptional
24.4%
Immigrants from Kenya
96.4
/100
|
#115
Exceptional
24.4%
Alaska Natives
96.0
/100
|
#116
Exceptional
24.4%
Immigrants from Afghanistan
95.9
/100
|
#117
Exceptional
24.4%
Immigrants from Micronesia
95.8
/100
|
#118
Exceptional
24.4%
Kenyans
95.8
/100
|
#119
Exceptional
24.5%
Cree
95.6
/100
|
#120
Exceptional
24.5%
Immigrants from Thailand
94.9
/100
|
#121
Exceptional
24.5%
Apache
94.8
/100
|
#122
Exceptional
24.5%
Natives/Alaskans
94.6
/100
|
#123
Exceptional
24.6%
Immigrants from South America
93.9
/100
|
#124
Exceptional
24.6%
Spanish Americans
93.8
/100
|
#125
Exceptional
24.6%
Immigrants from Uruguay
93.8
/100
|
#126
Exceptional
24.6%
German Russians
93.7
/100
|
#127
Exceptional
24.6%
Immigrants from Central America
93.5
/100
|
#128
Exceptional
24.6%

Immigrants from Thailand Wage/Income Gap Correlation Summary

MeasurementImmigrants from Thailand DataWage/Income Gap Data
Minimum0.054%6.1%
Maximum13.3%64.0%
Range13.2%57.9%
Mean3.6%26.3%
Median3.0%24.1%
Interquartile 25% (IQ1)1.4%17.3%
Interquartile 75% (IQ3)5.3%30.5%
Interquartile Range (IQR)3.8%13.2%
Standard Deviation (Sample)2.9%12.4%
Standard Deviation (Population)2.8%12.3%

Correlation Details

Immigrants from Thailand PercentileSample SizeWage/Income Gap
[
0.0%
-
0.5%
]
0.054%
196,991,29725.8%
[
0.0%
-
0.5%
]
0.16%
66,514,25725.9%
[
0.0%
-
0.5%
]
0.27%
23,652,83025.5%
[
0.0%
-
0.5%
]
0.38%
11,972,57525.3%
[
0.0%
-
0.5%
]
0.50%
6,068,81322.6%
[
0.5%
-
1.0%
]
0.61%
3,117,96723.4%
[
0.5%
-
1.0%
]
0.72%
2,375,09222.9%
[
0.5%
-
1.0%
]
0.83%
1,152,30423.1%
[
0.5%
-
1.0%
]
0.94%
683,45726.1%
[
1.0%
-
1.5%
]
1.06%
828,04124.6%
[
1.0%
-
1.5%
]
1.16%
474,16320.0%
[
1.0%
-
1.5%
]
1.27%
356,37829.3%
[
1.0%
-
1.5%
]
1.39%
520,87022.3%
[
1.5%
-
2.0%
]
1.51%
439,68321.9%
[
1.5%
-
2.0%
]
1.61%
197,59825.7%
[
1.5%
-
2.0%
]
1.76%
246,17617.1%
[
1.5%
-
2.0%
]
1.84%
108,57617.4%
[
1.5%
-
2.0%
]
1.95%
76,75414.6%
[
2.0%
-
2.5%
]
2.04%
163,22124.1%
[
2.0%
-
2.5%
]
2.19%
124,13719.0%
[
2.0%
-
2.5%
]
2.27%
87,25425.2%
[
2.0%
-
2.5%
]
2.35%
18,73528.0%
[
2.5%
-
3.0%
]
2.52%
16,66825.0%
[
2.5%
-
3.0%
]
2.65%
317,73316.6%
[
2.5%
-
3.0%
]
2.75%
23,71834.2%
[
2.5%
-
3.0%
]
2.85%
47,94923.3%
[
2.5%
-
3.0%
]
2.98%
58,62215.6%
[
3.0%
-
3.5%
]
3.09%
44,30923.1%
[
3.0%
-
3.5%
]
3.18%
1,4149.8%
[
3.0%
-
3.5%
]
3.30%
15,65131.0%
[
3.0%
-
3.5%
]
3.37%
2,58446.2%
[
3.0%
-
3.5%
]
3.49%
84,98512.3%
[
3.5%
-
4.0%
]
3.63%
17,6816.1%
[
3.5%
-
4.0%
]
3.75%
58733.9%
[
3.5%
-
4.0%
]
3.83%
3,49641.0%
[
4.0%
-
4.5%
]
4.06%
46843.6%
[
4.0%
-
4.5%
]
4.27%
46846.6%
[
4.0%
-
4.5%
]
4.44%
54013.4%
[
4.5%
-
5.0%
]
4.76%
98751.6%
[
5.0%
-
5.5%
]
5.19%
2898.9%
[
5.0%
-
5.5%
]
5.41%
29637.6%
[
5.0%
-
5.5%
]
5.46%
18324.8%
[
5.5%
-
6.0%
]
5.69%
87940.4%
[
5.5%
-
6.0%
]
5.93%
58,80716.0%
[
6.0%
-
6.5%
]
6.28%
55711.6%
[
6.5%
-
7.0%
]
6.51%
1,04556.0%
[
6.5%
-
7.0%
]
6.63%
19,61315.2%
[
6.5%
-
7.0%
]
6.70%
19,50122.5%
[
7.0%
-
7.5%
]
7.20%
2,33248.6%
[
9.0%
-
9.5%
]
9.38%
9664.0%
[
9.0%
-
9.5%
]
9.47%
1,03512.7%
[
11.0%
-
11.5%
]
11.33%
30921.1%
[
13.0%
-
13.5%
]
13.28%
73829.9%