Immigrants from Thailand 4 or more Vehicles in Household
COMPARE
Immigrants from Thailand
Select to Compare
4 or more Vehicles in Household
Immigrants from Thailand 4 or more Vehicles in Household
6.9%
4+ VEHICLES AVAILABLE
97.0/ 100
METRIC RATING
110th/ 347
METRIC RANK
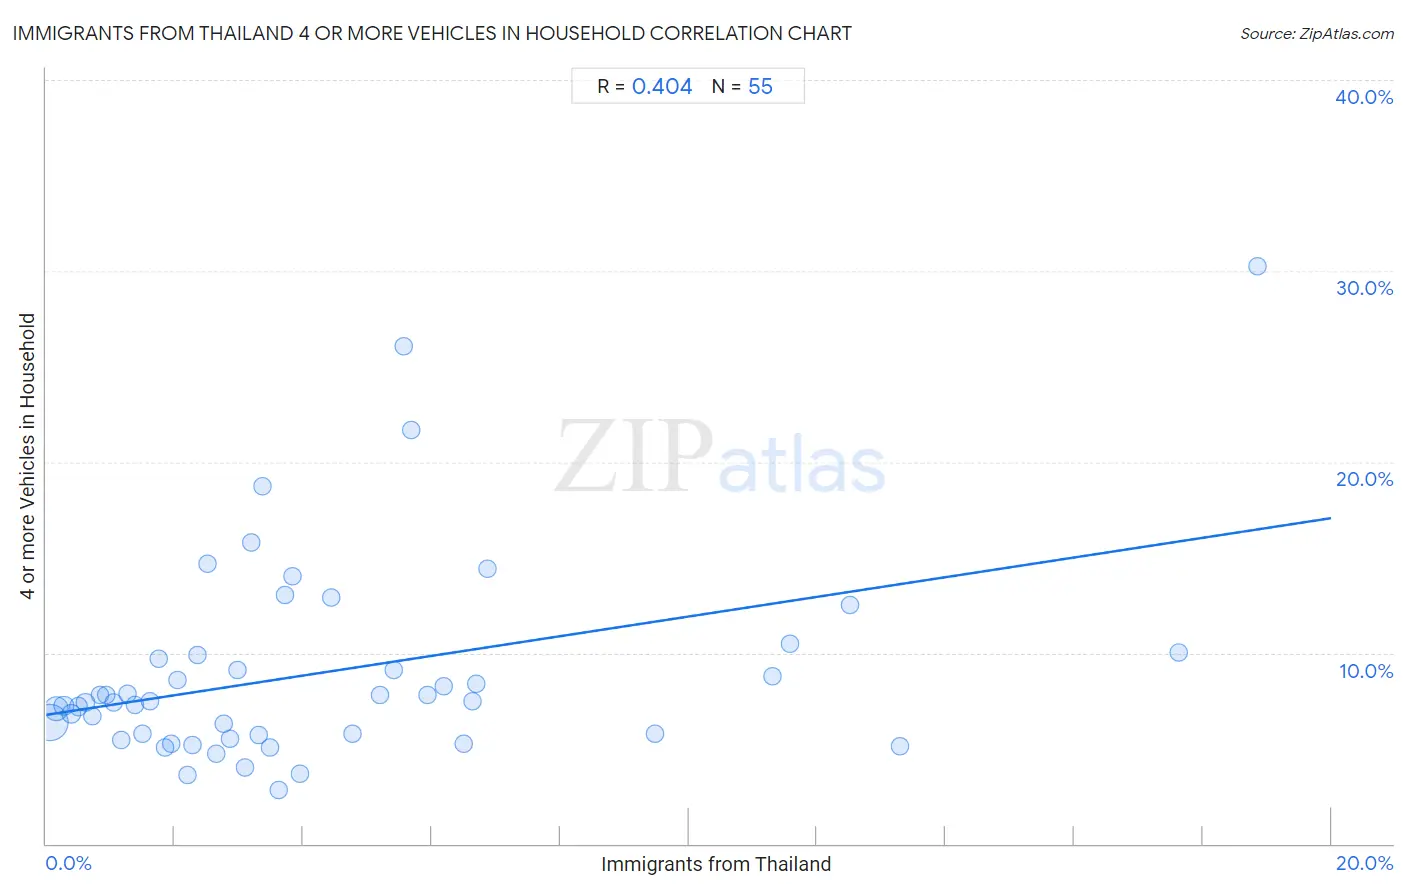
Immigrants from Thailand 4 or more Vehicles in Household Correlation Chart
The statistical analysis conducted on geographies consisting of 315,917,878 people shows a moderate positive correlation between the proportion of Immigrants from Thailand and percentage of households with 4 or more vehicles available in the United States with a correlation coefficient (R) of 0.404 and weighted average of 6.9%. On average, for every 1% (one percent) increase in Immigrants from Thailand within a typical geography, there is an increase of 0.52% in percentage of households with 4 or more vehicles available.
It is essential to understand that the correlation between the percentage of Immigrants from Thailand and percentage of households with 4 or more vehicles available does not imply a direct cause-and-effect relationship. It remains uncertain whether the presence of Immigrants from Thailand influences an upward or downward trend in the level of percentage of households with 4 or more vehicles available within an area, or if Immigrants from Thailand simply ended up residing in those areas with higher or lower levels of percentage of households with 4 or more vehicles available due to other factors.
Demographics Similar to Immigrants from Thailand by 4 or more Vehicles in Household
In terms of 4 or more vehicles in household, the demographic groups most similar to Immigrants from Thailand are Aleut (6.9%, a difference of 0.020%), Hopi (6.9%, a difference of 0.030%), Canadian (6.9%, a difference of 0.45%), Filipino (6.9%, a difference of 0.50%), and Bolivian (6.8%, a difference of 0.50%).
| Demographics | Rating | Rank | 4 or more Vehicles in Household |
| Blackfeet | 98.6 /100 | #103 | Exceptional 7.0% |
| Hmong | 98.3 /100 | #104 | Exceptional 7.0% |
| German Russians | 98.3 /100 | #105 | Exceptional 7.0% |
| Guatemalans | 98.1 /100 | #106 | Exceptional 7.0% |
| Nicaraguans | 98.0 /100 | #107 | Exceptional 7.0% |
| French | 97.7 /100 | #108 | Exceptional 6.9% |
| Filipinos | 97.6 /100 | #109 | Exceptional 6.9% |
| Immigrants from Thailand | 97.0 /100 | #110 | Exceptional 6.9% |
| Aleuts | 97.0 /100 | #111 | Exceptional 6.9% |
| Hopi | 97.0 /100 | #112 | Exceptional 6.9% |
| Canadians | 96.4 /100 | #113 | Exceptional 6.9% |
| Bolivians | 96.3 /100 | #114 | Exceptional 6.8% |
| Tlingit-Haida | 96.2 /100 | #115 | Exceptional 6.8% |
| Immigrants from Guatemala | 95.8 /100 | #116 | Exceptional 6.8% |
| Burmese | 95.7 /100 | #117 | Exceptional 6.8% |
Immigrants from Thailand 4 or more Vehicles in Household Correlation Summary
| Measurement | Immigrants from Thailand Data | 4 or more Vehicles in Household Data |
| Minimum | 0.054% | 2.8% |
| Maximum | 18.8% | 30.2% |
| Range | 18.8% | 27.4% |
| Mean | 4.3% | 9.0% |
| Median | 3.1% | 7.5% |
| Interquartile 25% (IQ1) | 1.5% | 5.7% |
| Interquartile 75% (IQ3) | 5.7% | 9.9% |
| Interquartile Range (IQR) | 4.2% | 4.2% |
| Standard Deviation (Sample) | 4.2% | 5.3% |
| Standard Deviation (Population) | 4.1% | 5.3% |
Correlation Details
| Immigrants from Thailand Percentile | Sample Size | 4 or more Vehicles in Household |
[ 0.0% - 0.5% ] 0.054% | 196,403,913 | 6.3% |
[ 0.0% - 0.5% ] 0.16% | 66,345,481 | 7.1% |
[ 0.0% - 0.5% ] 0.27% | 23,545,346 | 7.2% |
[ 0.0% - 0.5% ] 0.38% | 11,926,779 | 6.8% |
[ 0.0% - 0.5% ] 0.50% | 6,040,041 | 7.2% |
[ 0.5% - 1.0% ] 0.61% | 3,069,332 | 7.4% |
[ 0.5% - 1.0% ] 0.72% | 2,363,746 | 6.7% |
[ 0.5% - 1.0% ] 0.83% | 1,152,930 | 7.8% |
[ 0.5% - 1.0% ] 0.94% | 670,775 | 7.8% |
[ 1.0% - 1.5% ] 1.06% | 833,117 | 7.4% |
[ 1.0% - 1.5% ] 1.16% | 473,993 | 5.4% |
[ 1.0% - 1.5% ] 1.27% | 358,573 | 7.8% |
[ 1.0% - 1.5% ] 1.39% | 514,874 | 7.3% |
[ 1.5% - 2.0% ] 1.51% | 439,683 | 5.8% |
[ 1.5% - 2.0% ] 1.61% | 197,598 | 7.5% |
[ 1.5% - 2.0% ] 1.76% | 246,806 | 9.7% |
[ 1.5% - 2.0% ] 1.84% | 109,433 | 5.0% |
[ 1.5% - 2.0% ] 1.95% | 75,364 | 5.2% |
[ 2.0% - 2.5% ] 2.04% | 165,531 | 8.6% |
[ 2.0% - 2.5% ] 2.19% | 124,686 | 3.6% |
[ 2.0% - 2.5% ] 2.27% | 87,426 | 5.2% |
[ 2.0% - 2.5% ] 2.35% | 18,735 | 9.9% |
[ 2.5% - 3.0% ] 2.52% | 17,903 | 14.6% |
[ 2.5% - 3.0% ] 2.65% | 317,733 | 4.7% |
[ 2.5% - 3.0% ] 2.75% | 23,718 | 6.3% |
[ 2.5% - 3.0% ] 2.85% | 47,320 | 5.5% |
[ 2.5% - 3.0% ] 2.97% | 61,569 | 9.1% |
[ 3.0% - 3.5% ] 3.08% | 45,062 | 4.0% |
[ 3.0% - 3.5% ] 3.18% | 1,414 | 15.8% |
[ 3.0% - 3.5% ] 3.30% | 16,289 | 5.7% |
[ 3.0% - 3.5% ] 3.37% | 2,584 | 18.7% |
[ 3.0% - 3.5% ] 3.49% | 84,985 | 5.1% |
[ 3.5% - 4.0% ] 3.63% | 17,681 | 2.8% |
[ 3.5% - 4.0% ] 3.71% | 6,065 | 13.0% |
[ 3.5% - 4.0% ] 3.83% | 3,496 | 14.0% |
[ 3.5% - 4.0% ] 3.95% | 380 | 3.7% |
[ 4.0% - 4.5% ] 4.44% | 540 | 12.9% |
[ 4.5% - 5.0% ] 4.76% | 987 | 5.7% |
[ 5.0% - 5.5% ] 5.19% | 289 | 7.8% |
[ 5.0% - 5.5% ] 5.41% | 296 | 9.1% |
[ 5.5% - 6.0% ] 5.56% | 216 | 26.0% |
[ 5.5% - 6.0% ] 5.69% | 879 | 21.6% |
[ 5.5% - 6.0% ] 5.93% | 58,959 | 7.8% |
[ 6.0% - 6.5% ] 6.19% | 921 | 8.3% |
[ 6.5% - 7.0% ] 6.51% | 1,045 | 5.2% |
[ 6.5% - 7.0% ] 6.63% | 19,613 | 7.5% |
[ 6.5% - 7.0% ] 6.70% | 19,501 | 8.4% |
[ 6.5% - 7.0% ] 6.87% | 262 | 14.4% |
[ 9.0% - 9.5% ] 9.47% | 1,035 | 5.8% |
[ 11.0% - 11.5% ] 11.30% | 478 | 8.7% |
[ 11.5% - 12.0% ] 11.57% | 1,132 | 10.5% |
[ 12.0% - 12.5% ] 12.50% | 32 | 12.5% |
[ 13.0% - 13.5% ] 13.28% | 738 | 5.1% |
[ 17.5% - 18.0% ] 17.62% | 403 | 10.0% |
[ 18.5% - 19.0% ] 18.85% | 191 | 30.2% |