Immigrants from Thailand Disability Age Under 5
COMPARE
Immigrants from Thailand
Select to Compare
Disability Age Under 5
Immigrants from Thailand Disability Age Under 5
1.2%
DISABILITY | AGE UNDER 5
69.4/ 100
METRIC RATING
153rd/ 347
METRIC RANK
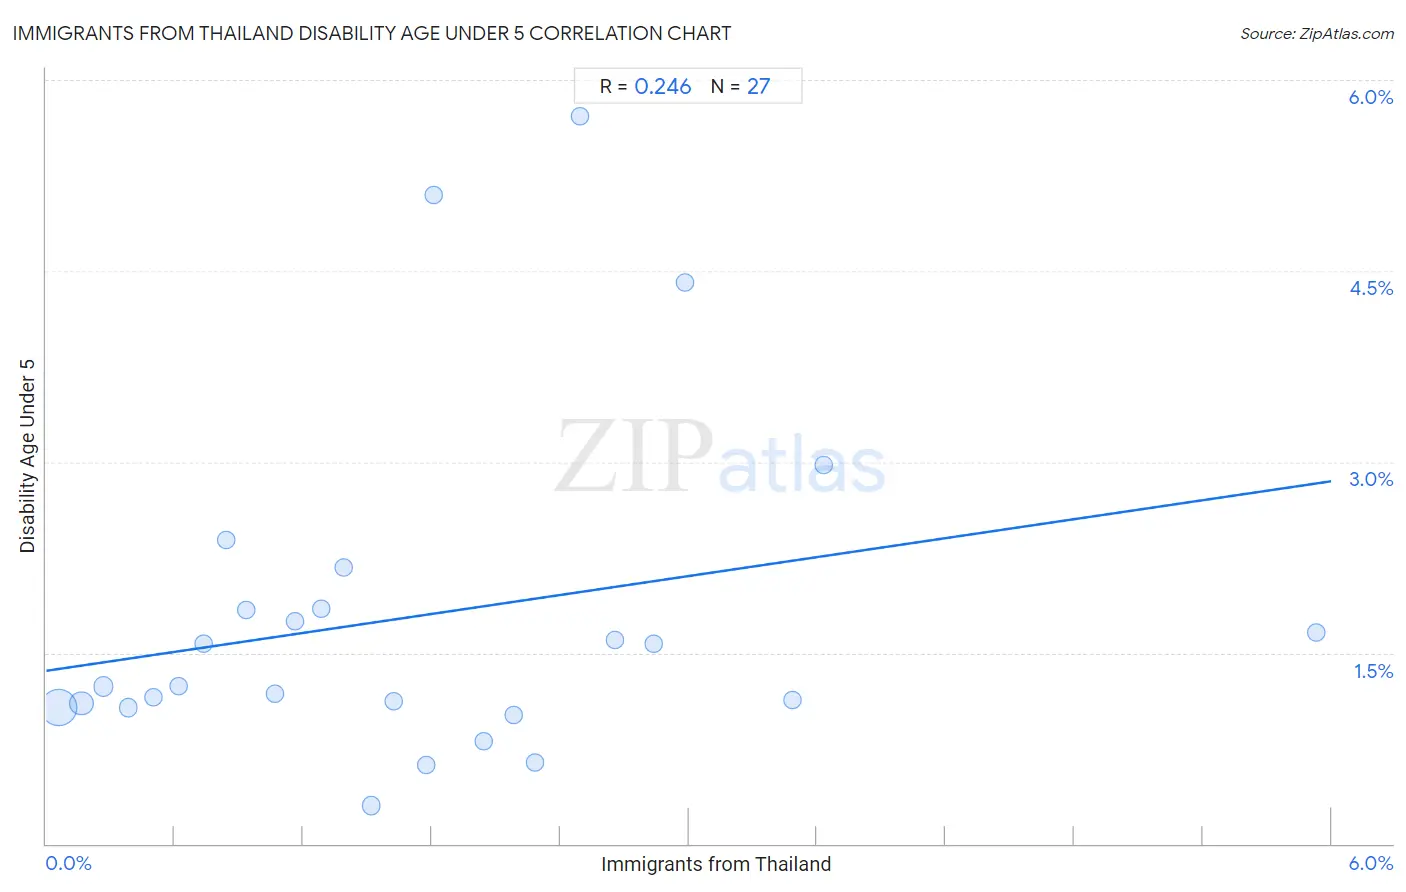
Immigrants from Thailand Disability Age Under 5 Correlation Chart
The statistical analysis conducted on geographies consisting of 187,942,657 people shows a weak positive correlation between the proportion of Immigrants from Thailand and percentage of population with a disability under the age of 5 in the United States with a correlation coefficient (R) of 0.246 and weighted average of 1.2%. On average, for every 1% (one percent) increase in Immigrants from Thailand within a typical geography, there is an increase of 0.25% in percentage of population with a disability under the age of 5.
It is essential to understand that the correlation between the percentage of Immigrants from Thailand and percentage of population with a disability under the age of 5 does not imply a direct cause-and-effect relationship. It remains uncertain whether the presence of Immigrants from Thailand influences an upward or downward trend in the level of percentage of population with a disability under the age of 5 within an area, or if Immigrants from Thailand simply ended up residing in those areas with higher or lower levels of percentage of population with a disability under the age of 5 due to other factors.
Demographics Similar to Immigrants from Thailand by Disability Age Under 5
In terms of disability age under 5, the demographic groups most similar to Immigrants from Thailand are Uruguayan (1.2%, a difference of 0.070%), Immigrants from Ghana (1.2%, a difference of 0.080%), Hawaiian (1.2%, a difference of 0.10%), Immigrants from South America (1.2%, a difference of 0.26%), and Arab (1.2%, a difference of 0.32%).
| Demographics | Rating | Rank | Disability Age Under 5 |
| Samoans | 77.7 /100 | #146 | Good 1.2% |
| Icelanders | 76.3 /100 | #147 | Good 1.2% |
| Ghanaians | 76.3 /100 | #148 | Good 1.2% |
| Kenyans | 75.9 /100 | #149 | Good 1.2% |
| South Americans | 75.6 /100 | #150 | Good 1.2% |
| Yaqui | 74.8 /100 | #151 | Good 1.2% |
| Hondurans | 72.5 /100 | #152 | Good 1.2% |
| Immigrants from Thailand | 69.4 /100 | #153 | Good 1.2% |
| Uruguayans | 68.8 /100 | #154 | Good 1.2% |
| Immigrants from Ghana | 68.7 /100 | #155 | Good 1.2% |
| Hawaiians | 68.5 /100 | #156 | Good 1.2% |
| Immigrants from South America | 67.0 /100 | #157 | Good 1.2% |
| Arabs | 66.4 /100 | #158 | Good 1.2% |
| Colombians | 65.8 /100 | #159 | Good 1.2% |
| Immigrants from Latin America | 65.8 /100 | #160 | Good 1.2% |
Immigrants from Thailand Disability Age Under 5 Correlation Summary
| Measurement | Immigrants from Thailand Data | Disability Age Under 5 Data |
| Minimum | 0.056% | 0.30% |
| Maximum | 5.9% | 5.7% |
| Range | 5.9% | 5.4% |
| Mean | 1.7% | 1.8% |
| Median | 1.5% | 1.2% |
| Interquartile 25% (IQ1) | 0.73% | 1.1% |
| Interquartile 75% (IQ3) | 2.5% | 1.9% |
| Interquartile Range (IQR) | 1.8% | 0.78% |
| Standard Deviation (Sample) | 1.3% | 1.3% |
| Standard Deviation (Population) | 1.3% | 1.3% |
Correlation Details
| Immigrants from Thailand Percentile | Sample Size | Disability Age Under 5 |
[ 0.0% - 0.5% ] 0.056% | 121,586,806 | 1.1% |
[ 0.0% - 0.5% ] 0.16% | 37,590,222 | 1.1% |
[ 0.0% - 0.5% ] 0.27% | 13,015,336 | 1.2% |
[ 0.0% - 0.5% ] 0.38% | 6,199,709 | 1.1% |
[ 0.0% - 0.5% ] 0.50% | 3,560,947 | 1.2% |
[ 0.5% - 1.0% ] 0.62% | 1,356,771 | 1.2% |
[ 0.5% - 1.0% ] 0.73% | 1,318,888 | 1.6% |
[ 0.5% - 1.0% ] 0.84% | 273,550 | 2.4% |
[ 0.5% - 1.0% ] 0.93% | 342,206 | 1.8% |
[ 1.0% - 1.5% ] 1.07% | 502,297 | 1.2% |
[ 1.0% - 1.5% ] 1.16% | 339,405 | 1.7% |
[ 1.0% - 1.5% ] 1.28% | 235,658 | 1.9% |
[ 1.0% - 1.5% ] 1.39% | 307,582 | 2.2% |
[ 1.5% - 2.0% ] 1.52% | 259,899 | 0.30% |
[ 1.5% - 2.0% ] 1.62% | 50,546 | 1.1% |
[ 1.5% - 2.0% ] 1.77% | 184,223 | 0.62% |
[ 1.5% - 2.0% ] 1.81% | 26,023 | 5.1% |
[ 2.0% - 2.5% ] 2.04% | 111,492 | 0.81% |
[ 2.0% - 2.5% ] 2.18% | 91,296 | 1.0% |
[ 2.0% - 2.5% ] 2.28% | 56,712 | 0.63% |
[ 2.0% - 2.5% ] 2.49% | 7,581 | 5.7% |
[ 2.5% - 3.0% ] 2.65% | 308,806 | 1.6% |
[ 2.5% - 3.0% ] 2.84% | 14,212 | 1.6% |
[ 2.5% - 3.0% ] 2.98% | 45,105 | 4.4% |
[ 3.0% - 3.5% ] 3.49% | 83,384 | 1.1% |
[ 3.5% - 4.0% ] 3.63% | 16,339 | 3.0% |
[ 5.5% - 6.0% ] 5.93% | 57,662 | 1.7% |