Immigrants from Thailand Married-couple Households
COMPARE
Immigrants from Thailand
Select to Compare
Married-couple Households
Immigrants from Thailand Married-couple Households
45.2%
MARRIED-COUPLE HOUSEHOLDS
5.1/ 100
METRIC RATING
220th/ 347
METRIC RANK
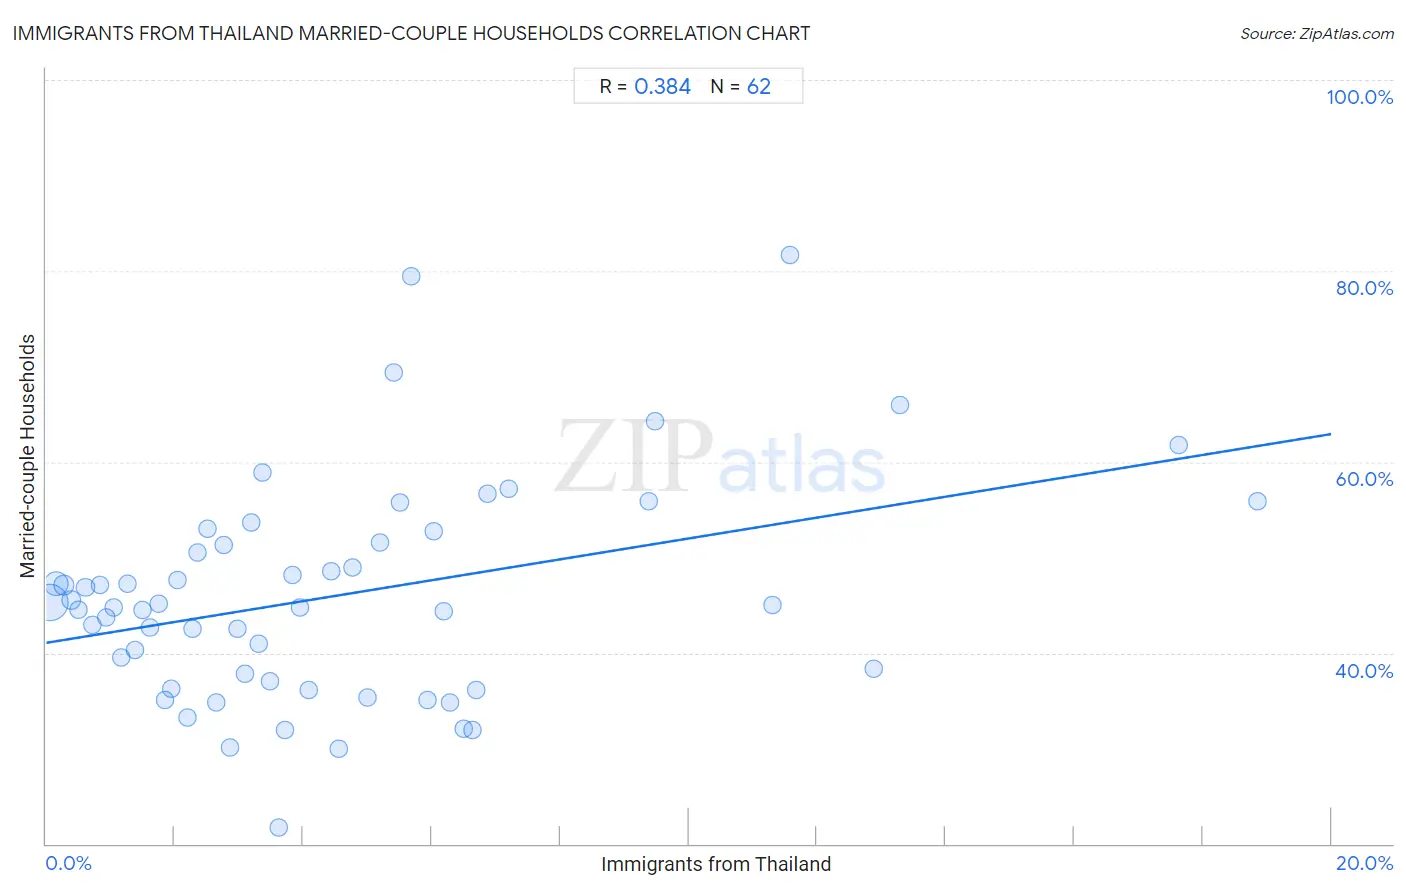
Immigrants from Thailand Married-couple Households Correlation Chart
The statistical analysis conducted on geographies consisting of 316,918,877 people shows a mild positive correlation between the proportion of Immigrants from Thailand and percentage of married-couple family households in the United States with a correlation coefficient (R) of 0.384 and weighted average of 45.2%. On average, for every 1% (one percent) increase in Immigrants from Thailand within a typical geography, there is an increase of 1.1% in percentage of married-couple family households.
It is essential to understand that the correlation between the percentage of Immigrants from Thailand and percentage of married-couple family households does not imply a direct cause-and-effect relationship. It remains uncertain whether the presence of Immigrants from Thailand influences an upward or downward trend in the level of percentage of married-couple family households within an area, or if Immigrants from Thailand simply ended up residing in those areas with higher or lower levels of percentage of married-couple family households due to other factors.
Demographics Similar to Immigrants from Thailand by Married-couple Households
In terms of married-couple households, the demographic groups most similar to Immigrants from Thailand are Nicaraguan (45.2%, a difference of 0.030%), Immigrants from the Azores (45.2%, a difference of 0.040%), Tlingit-Haida (45.1%, a difference of 0.050%), Panamanian (45.2%, a difference of 0.060%), and Immigrants from Nepal (45.2%, a difference of 0.090%).
| Demographics | Rating | Rank | Married-couple Households |
| Yakama | 5.8 /100 | #213 | Tragic 45.2% |
| Japanese | 5.7 /100 | #214 | Tragic 45.2% |
| Immigrants from Nepal | 5.6 /100 | #215 | Tragic 45.2% |
| Immigrants from Portugal | 5.6 /100 | #216 | Tragic 45.2% |
| Panamanians | 5.5 /100 | #217 | Tragic 45.2% |
| Immigrants from the Azores | 5.3 /100 | #218 | Tragic 45.2% |
| Nicaraguans | 5.3 /100 | #219 | Tragic 45.2% |
| Immigrants from Thailand | 5.1 /100 | #220 | Tragic 45.2% |
| Tlingit-Haida | 4.9 /100 | #221 | Tragic 45.1% |
| Immigrants from Laos | 4.6 /100 | #222 | Tragic 45.1% |
| Immigrants from Cambodia | 2.7 /100 | #223 | Tragic 44.9% |
| Immigrants from Micronesia | 2.6 /100 | #224 | Tragic 44.9% |
| Dutch West Indians | 2.6 /100 | #225 | Tragic 44.9% |
| Alsatians | 2.3 /100 | #226 | Tragic 44.8% |
| Salvadorans | 1.9 /100 | #227 | Tragic 44.7% |
Immigrants from Thailand Married-couple Households Correlation Summary
| Measurement | Immigrants from Thailand Data | Married-couple Households Data |
| Minimum | 0.054% | 21.7% |
| Maximum | 18.8% | 81.7% |
| Range | 18.8% | 59.9% |
| Mean | 4.5% | 46.0% |
| Median | 3.4% | 44.9% |
| Interquartile 25% (IQ1) | 1.8% | 37.0% |
| Interquartile 75% (IQ3) | 6.0% | 51.6% |
| Interquartile Range (IQR) | 4.3% | 14.5% |
| Standard Deviation (Sample) | 4.0% | 11.4% |
| Standard Deviation (Population) | 4.0% | 11.4% |
Correlation Details
| Immigrants from Thailand Percentile | Sample Size | Married-couple Households |
[ 0.0% - 0.5% ] 0.054% | 196,957,427 | 45.2% |
[ 0.0% - 0.5% ] 0.16% | 66,522,254 | 47.2% |
[ 0.0% - 0.5% ] 0.27% | 23,649,638 | 47.1% |
[ 0.0% - 0.5% ] 0.38% | 11,969,017 | 45.5% |
[ 0.0% - 0.5% ] 0.50% | 6,067,006 | 44.5% |
[ 0.5% - 1.0% ] 0.61% | 3,124,618 | 46.8% |
[ 0.5% - 1.0% ] 0.72% | 2,376,855 | 42.9% |
[ 0.5% - 1.0% ] 0.83% | 1,154,456 | 47.1% |
[ 0.5% - 1.0% ] 0.94% | 681,586 | 43.7% |
[ 1.0% - 1.5% ] 1.06% | 833,117 | 44.7% |
[ 1.0% - 1.5% ] 1.16% | 473,993 | 39.5% |
[ 1.0% - 1.5% ] 1.27% | 358,573 | 47.3% |
[ 1.0% - 1.5% ] 1.39% | 519,302 | 40.3% |
[ 1.5% - 2.0% ] 1.51% | 439,683 | 44.4% |
[ 1.5% - 2.0% ] 1.61% | 197,779 | 42.6% |
[ 1.5% - 2.0% ] 1.76% | 249,880 | 45.1% |
[ 1.5% - 2.0% ] 1.84% | 109,699 | 35.0% |
[ 1.5% - 2.0% ] 1.95% | 76,754 | 36.2% |
[ 2.0% - 2.5% ] 2.04% | 165,531 | 47.7% |
[ 2.0% - 2.5% ] 2.19% | 124,686 | 33.2% |
[ 2.0% - 2.5% ] 2.27% | 87,426 | 42.5% |
[ 2.0% - 2.5% ] 2.35% | 18,735 | 50.4% |
[ 2.5% - 3.0% ] 2.52% | 18,268 | 53.0% |
[ 2.5% - 3.0% ] 2.65% | 317,962 | 34.8% |
[ 2.5% - 3.0% ] 2.75% | 23,718 | 51.3% |
[ 2.5% - 3.0% ] 2.85% | 47,949 | 30.1% |
[ 2.5% - 3.0% ] 2.97% | 61,569 | 42.5% |
[ 3.0% - 3.5% ] 3.08% | 45,062 | 37.8% |
[ 3.0% - 3.5% ] 3.18% | 1,414 | 53.7% |
[ 3.0% - 3.5% ] 3.30% | 16,289 | 40.9% |
[ 3.0% - 3.5% ] 3.37% | 2,584 | 58.9% |
[ 3.0% - 3.5% ] 3.49% | 85,478 | 37.0% |
[ 3.5% - 4.0% ] 3.63% | 17,681 | 21.7% |
[ 3.5% - 4.0% ] 3.71% | 6,065 | 31.9% |
[ 3.5% - 4.0% ] 3.83% | 3,496 | 48.1% |
[ 3.5% - 4.0% ] 3.95% | 380 | 44.8% |
[ 4.0% - 4.5% ] 4.08% | 834 | 36.2% |
[ 4.0% - 4.5% ] 4.44% | 540 | 48.5% |
[ 4.5% - 5.0% ] 4.55% | 88 | 30.0% |
[ 4.5% - 5.0% ] 4.76% | 987 | 48.9% |
[ 5.0% - 5.5% ] 5.00% | 80 | 35.3% |
[ 5.0% - 5.5% ] 5.19% | 289 | 51.6% |
[ 5.0% - 5.5% ] 5.41% | 296 | 69.4% |
[ 5.5% - 6.0% ] 5.51% | 399 | 55.7% |
[ 5.5% - 6.0% ] 5.69% | 879 | 79.5% |
[ 5.5% - 6.0% ] 5.93% | 58,959 | 35.1% |
[ 6.0% - 6.5% ] 6.03% | 564 | 52.7% |
[ 6.0% - 6.5% ] 6.18% | 1,035 | 44.3% |
[ 6.0% - 6.5% ] 6.28% | 557 | 34.8% |
[ 6.5% - 7.0% ] 6.51% | 1,045 | 32.1% |
[ 6.5% - 7.0% ] 6.63% | 19,613 | 31.9% |
[ 6.5% - 7.0% ] 6.70% | 19,501 | 36.1% |
[ 6.5% - 7.0% ] 6.87% | 262 | 56.7% |
[ 7.0% - 7.5% ] 7.20% | 2,332 | 57.1% |
[ 9.0% - 9.5% ] 9.38% | 96 | 55.9% |
[ 9.0% - 9.5% ] 9.47% | 1,035 | 64.3% |
[ 11.0% - 11.5% ] 11.30% | 478 | 45.0% |
[ 11.5% - 12.0% ] 11.57% | 1,132 | 81.7% |
[ 12.5% - 13.0% ] 12.87% | 404 | 38.3% |
[ 13.0% - 13.5% ] 13.29% | 948 | 65.9% |
[ 17.5% - 18.0% ] 17.62% | 403 | 61.8% |
[ 18.5% - 19.0% ] 18.85% | 191 | 55.8% |