Immigrants from Sudan 1 or more Vehicles in Household
COMPARE
Immigrants from Sudan
Select to Compare
1 or more Vehicles in Household
Immigrants from Sudan 1 or more Vehicles in Household
89.7%
1+ VEHICLES AVAILABLE
47.1/ 100
METRIC RATING
176th/ 347
METRIC RANK
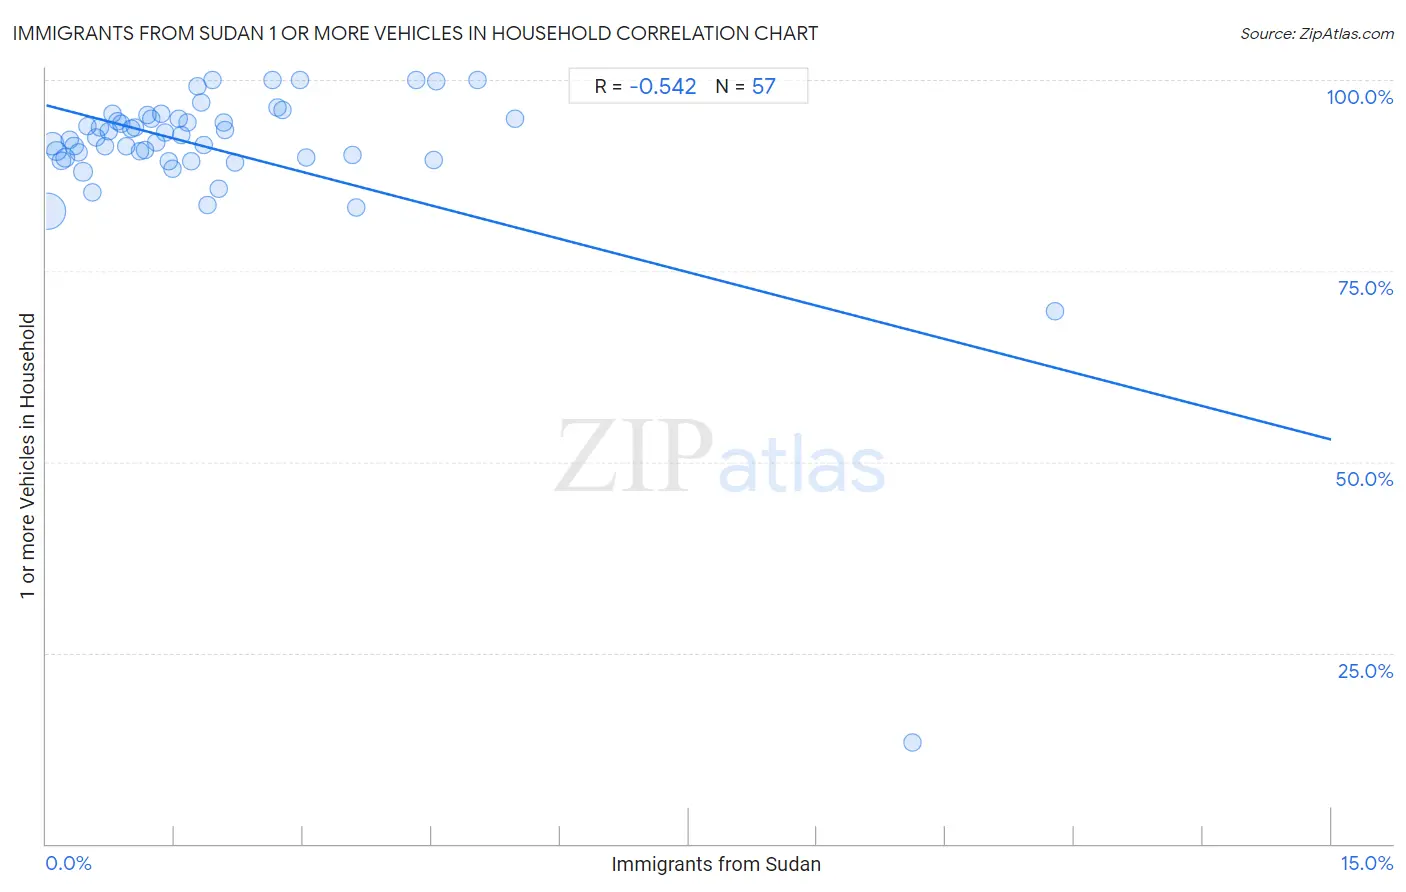
Immigrants from Sudan 1 or more Vehicles in Household Correlation Chart
The statistical analysis conducted on geographies consisting of 118,959,591 people shows a substantial negative correlation between the proportion of Immigrants from Sudan and percentage of households with 1 or more vehicles available in the United States with a correlation coefficient (R) of -0.542 and weighted average of 89.7%. On average, for every 1% (one percent) increase in Immigrants from Sudan within a typical geography, there is a decrease of 2.9% in percentage of households with 1 or more vehicles available.
It is essential to understand that the correlation between the percentage of Immigrants from Sudan and percentage of households with 1 or more vehicles available does not imply a direct cause-and-effect relationship. It remains uncertain whether the presence of Immigrants from Sudan influences an upward or downward trend in the level of percentage of households with 1 or more vehicles available within an area, or if Immigrants from Sudan simply ended up residing in those areas with higher or lower levels of percentage of households with 1 or more vehicles available due to other factors.
Demographics Similar to Immigrants from Sudan by 1 or more Vehicles in Household
In terms of 1 or more vehicles in household, the demographic groups most similar to Immigrants from Sudan are Immigrants from Burma/Myanmar (89.7%, a difference of 0.010%), Hmong (89.6%, a difference of 0.020%), Filipino (89.7%, a difference of 0.050%), Immigrants from El Salvador (89.6%, a difference of 0.050%), and German Russian (89.6%, a difference of 0.050%).
| Demographics | Rating | Rank | 1 or more Vehicles in Household |
| Natives/Alaskans | 59.5 /100 | #169 | Average 89.8% |
| Immigrants from Costa Rica | 57.6 /100 | #170 | Average 89.8% |
| French American Indians | 54.4 /100 | #171 | Average 89.8% |
| Indonesians | 53.0 /100 | #172 | Average 89.7% |
| Lumbee | 52.8 /100 | #173 | Average 89.7% |
| Filipinos | 50.0 /100 | #174 | Average 89.7% |
| Immigrants from Burma/Myanmar | 47.6 /100 | #175 | Average 89.7% |
| Immigrants from Sudan | 47.1 /100 | #176 | Average 89.7% |
| Hmong | 45.8 /100 | #177 | Average 89.6% |
| Immigrants from El Salvador | 44.1 /100 | #178 | Average 89.6% |
| German Russians | 44.0 /100 | #179 | Average 89.6% |
| Arabs | 43.3 /100 | #180 | Average 89.6% |
| Immigrants from Ethiopia | 42.5 /100 | #181 | Average 89.6% |
| Ukrainians | 42.4 /100 | #182 | Average 89.6% |
| Ethiopians | 41.2 /100 | #183 | Average 89.6% |
Immigrants from Sudan 1 or more Vehicles in Household Correlation Summary
| Measurement | Immigrants from Sudan Data | 1 or more Vehicles in Household Data |
| Minimum | 0.020% | 13.3% |
| Maximum | 11.8% | 100.0% |
| Range | 11.8% | 86.7% |
| Mean | 2.0% | 90.9% |
| Median | 1.4% | 92.4% |
| Interquartile 25% (IQ1) | 0.70% | 89.7% |
| Interquartile 75% (IQ3) | 2.4% | 95.0% |
| Interquartile Range (IQR) | 1.7% | 5.3% |
| Standard Deviation (Sample) | 2.2% | 11.7% |
| Standard Deviation (Population) | 2.1% | 11.6% |
Correlation Details
| Immigrants from Sudan Percentile | Sample Size | 1 or more Vehicles in Household |
[ 0.0% - 0.5% ] 0.020% | 75,067,944 | 82.7% |
[ 0.0% - 0.5% ] 0.071% | 20,339,032 | 91.7% |
[ 0.0% - 0.5% ] 0.12% | 7,194,376 | 90.7% |
[ 0.0% - 0.5% ] 0.18% | 3,781,382 | 89.4% |
[ 0.0% - 0.5% ] 0.23% | 3,078,145 | 89.8% |
[ 0.0% - 0.5% ] 0.28% | 2,015,225 | 92.1% |
[ 0.0% - 0.5% ] 0.33% | 1,532,131 | 91.3% |
[ 0.0% - 0.5% ] 0.38% | 1,266,083 | 90.6% |
[ 0.0% - 0.5% ] 0.43% | 630,979 | 88.0% |
[ 0.0% - 0.5% ] 0.48% | 544,135 | 94.0% |
[ 0.5% - 1.0% ] 0.54% | 1,024,878 | 85.3% |
[ 0.5% - 1.0% ] 0.58% | 292,392 | 92.4% |
[ 0.5% - 1.0% ] 0.63% | 494,091 | 93.7% |
[ 0.5% - 1.0% ] 0.68% | 119,379 | 91.3% |
[ 0.5% - 1.0% ] 0.73% | 209,238 | 93.3% |
[ 0.5% - 1.0% ] 0.78% | 2,440 | 95.5% |
[ 0.5% - 1.0% ] 0.84% | 200,902 | 94.6% |
[ 0.5% - 1.0% ] 0.88% | 66,303 | 94.3% |
[ 0.5% - 1.0% ] 0.93% | 156,353 | 91.3% |
[ 0.5% - 1.0% ] 0.99% | 91,706 | 93.6% |
[ 1.0% - 1.5% ] 1.03% | 36,373 | 93.9% |
[ 1.0% - 1.5% ] 1.09% | 99,050 | 90.7% |
[ 1.0% - 1.5% ] 1.15% | 32,273 | 90.9% |
[ 1.0% - 1.5% ] 1.19% | 590 | 95.4% |
[ 1.0% - 1.5% ] 1.23% | 76,476 | 95.0% |
[ 1.0% - 1.5% ] 1.28% | 75,877 | 91.8% |
[ 1.0% - 1.5% ] 1.34% | 63,722 | 95.6% |
[ 1.0% - 1.5% ] 1.39% | 14,296 | 93.1% |
[ 1.0% - 1.5% ] 1.43% | 37,579 | 89.4% |
[ 1.0% - 1.5% ] 1.48% | 8,129 | 88.4% |
[ 1.5% - 2.0% ] 1.55% | 2,776 | 94.9% |
[ 1.5% - 2.0% ] 1.58% | 10,067 | 92.8% |
[ 1.5% - 2.0% ] 1.65% | 43,066 | 94.4% |
[ 1.5% - 2.0% ] 1.70% | 90,570 | 89.3% |
[ 1.5% - 2.0% ] 1.77% | 11,811 | 99.2% |
[ 1.5% - 2.0% ] 1.80% | 12,743 | 97.1% |
[ 1.5% - 2.0% ] 1.85% | 17,070 | 91.4% |
[ 1.5% - 2.0% ] 1.89% | 18,690 | 83.6% |
[ 1.5% - 2.0% ] 1.94% | 3,514 | 100.0% |
[ 2.0% - 2.5% ] 2.01% | 20,834 | 85.8% |
[ 2.0% - 2.5% ] 2.07% | 21,646 | 94.5% |
[ 2.0% - 2.5% ] 2.09% | 31,976 | 93.5% |
[ 2.0% - 2.5% ] 2.20% | 40,418 | 89.3% |
[ 2.5% - 3.0% ] 2.64% | 1,214 | 100.0% |
[ 2.5% - 3.0% ] 2.71% | 2,513 | 96.4% |
[ 2.5% - 3.0% ] 2.75% | 2,324 | 96.0% |
[ 2.5% - 3.0% ] 2.96% | 439 | 100.0% |
[ 3.0% - 3.5% ] 3.03% | 21,420 | 89.9% |
[ 3.5% - 4.0% ] 3.58% | 3,440 | 90.2% |
[ 3.5% - 4.0% ] 3.62% | 10,380 | 83.3% |
[ 4.0% - 4.5% ] 4.32% | 533 | 100.0% |
[ 4.5% - 5.0% ] 4.52% | 22,340 | 89.6% |
[ 4.5% - 5.0% ] 4.55% | 7,203 | 99.9% |
[ 5.0% - 5.5% ] 5.03% | 6,516 | 100.0% |
[ 5.0% - 5.5% ] 5.48% | 347 | 94.9% |
[ 10.0% - 10.5% ] 10.12% | 1,206 | 13.3% |
[ 11.5% - 12.0% ] 11.78% | 3,056 | 69.8% |