Immigrants from Sudan Self-Care Disability

COMPARE

Immigrants from Sudan
Race
Ancestry
AfghanAfricanAlaska NativeAlaskan AthabascanAlbanianAleutAlsatianAmericanApacheArabArapahoArgentineanArmenianAssyrian/Chaldean/SyriacAustralianAustrianBahamianBangladeshiBarbadianBasqueBelgianBelizeanBermudanBhutaneseBlackfeetBolivianBrazilianBritishBritish West IndianBulgarianBurmeseCajunCambodianCanadianCape VerdeanCarpatho RusynCelticCentral AmericanCentral American IndianCherokeeCheyenneChickasawChileanChineseChippewaChoctawColombianColvilleComancheCosta RicanCreeCreekCroatianCrowCubanCypriotCzechCzechoslovakianDanishDelawareDominicanDutchDutch West IndianEastern EuropeanEcuadorianEgyptianEnglishEstonianEthiopianEuropeanFijianFilipinoFinnishFrenchFrench American IndianFrench CanadianGermanGerman RussianGhanaianGreekGuamanian/ChamorroGuatemalanGuyaneseHaitianHmongHonduranHopiHoumaHungarianIcelanderIndian (Asian)IndonesianInupiatIranianIraqiIrishIroquoisIsraeliItalianJamaicanJapaneseJordanianKenyanKiowaKoreanLaotianLatvianLebaneseLiberianLithuanianLumbeeLuxembourgerMacedonianMalaysianMalteseMarshalleseMenomineeMexicanMexican American IndianMongolianMoroccanNative HawaiianNavajoNepaleseNew ZealanderNicaraguanNigerianNorthern EuropeanNorwegianOkinawanOsageOttawaPaiutePakistaniPalestinianPanamanianParaguayanPennsylvania GermanPeruvianPimaPolishPortuguesePotawatomiPuebloPuerto RicanPuget Sound SalishRomanianRussianSalvadoranSamoanScandinavianScotch-IrishScottishSeminoleSenegaleseSerbianShoshoneSierra LeoneanSiouxSlavicSlovakSloveneSomaliSouth AfricanSouth AmericanSouth American IndianSoviet UnionSpaniardSpanishSpanish AmericanSpanish American IndianSri LankanSubsaharan AfricanSudaneseSwedishSwissSyrianTaiwaneseThaiTlingit-HaidaTohono O'OdhamTonganTrinidadian and TobagonianTsimshianTurkishU.S. Virgin IslanderUgandanUkrainianUruguayanUteVenezuelanVietnameseWelshWest IndianYakamaYaquiYugoslavianYumanYup'ikZimbabwean
Immigration
NonimmigrantsImmigrantsAfghanistanAfricaAlbaniaArgentinaArmeniaAsiaAustraliaAustriaBahamasBangladeshBarbadosBelarusBelgiumBelizeBoliviaBosnia and HerzegovinaBrazilBulgariaBurma/MyanmarCabo VerdeCambodiaCameroonCanadaCaribbeanCentral AmericaChileChinaColombiaCongoCosta RicaCroatiaCubaCzechoslovakiaDenmarkDominicaDominican RepublicEastern AfricaEastern AsiaEastern EuropeEcuadorEgyptEl SalvadorEnglandEritreaEthiopiaEuropeFijiFranceGermanyGhanaGreeceGrenadaGuatemalaGuyanaHaitiHondurasHong KongHungaryIndiaIndonesiaIranIraqIrelandIsraelItalyJamaicaJapanJordanKazakhstanKenyaKoreaKuwaitLaosLatin AmericaLatviaLebanonLiberiaLithuaniaMalaysiaMexicoMicronesiaMiddle AfricaMoldovaMoroccoNepalNetherlandsNicaraguaNigeriaNorth AmericaNorth MacedoniaNorthern AfricaNorthern EuropeNorwayOceaniaPakistanPanamaPeruPhilippinesPolandPortugalRomaniaRussiaSaudi ArabiaScotlandSenegalSerbiaSierra LeoneSingaporeSomaliaSouth AfricaSouth AmericaSouth Central AsiaSouth Eastern AsiaSouthern EuropeSpainSri LankaSt. Vincent and the GrenadinesSudanSwedenSwitzerlandSyriaTaiwanThailandTrinidad and TobagoTurkeyUgandaUkraineUruguayUzbekistanVenezuelaVietnamWest IndiesWestern AfricaWestern AsiaWestern EuropeYemenZaireZimbabweAzores
Select to Compare
Race
Ancestry
AfghanAfricanAlaska NativeAlaskan AthabascanAlbanianAleutAlsatianAmericanApacheArabArapahoArgentineanArmenianAssyrian/Chaldean/SyriacAustralianAustrianBahamianBangladeshiBarbadianBasqueBelgianBelizeanBermudanBhutaneseBlackfeetBolivianBrazilianBritishBritish West IndianBulgarianBurmeseCajunCambodianCanadianCape VerdeanCarpatho RusynCelticCentral AmericanCentral American IndianCherokeeCheyenneChickasawChileanChineseChippewaChoctawColombianColvilleComancheCosta RicanCreeCreekCroatianCrowCubanCypriotCzechCzechoslovakianDanishDelawareDominicanDutchDutch West IndianEastern EuropeanEcuadorianEgyptianEnglishEstonianEthiopianEuropeanFijianFilipinoFinnishFrenchFrench American IndianFrench CanadianGermanGerman RussianGhanaianGreekGuamanian/ChamorroGuatemalanGuyaneseHaitianHmongHonduranHopiHoumaHungarianIcelanderIndian (Asian)IndonesianInupiatIranianIraqiIrishIroquoisIsraeliItalianJamaicanJapaneseJordanianKenyanKiowaKoreanLaotianLatvianLebaneseLiberianLithuanianLumbeeLuxembourgerMacedonianMalaysianMalteseMarshalleseMenomineeMexicanMexican American IndianMongolianMoroccanNative HawaiianNavajoNepaleseNew ZealanderNicaraguanNigerianNorthern EuropeanNorwegianOkinawanOsageOttawaPaiutePakistaniPalestinianPanamanianParaguayanPennsylvania GermanPeruvianPimaPolishPortuguesePotawatomiPuebloPuerto RicanPuget Sound SalishRomanianRussianSalvadoranSamoanScandinavianScotch-IrishScottishSeminoleSenegaleseSerbianShoshoneSierra LeoneanSiouxSlavicSlovakSloveneSomaliSouth AfricanSouth AmericanSouth American IndianSoviet UnionSpaniardSpanishSpanish AmericanSpanish American IndianSri LankanSubsaharan AfricanSudaneseSwedishSwissSyrianTaiwaneseThaiTlingit-HaidaTohono O'OdhamTonganTrinidadian and TobagonianTsimshianTurkishU.S. Virgin IslanderUgandanUkrainianUruguayanUteVenezuelanVietnameseWelshWest IndianYakamaYaquiYugoslavianYumanYup'ikZimbabwean
Immigration
NonimmigrantsImmigrantsAfghanistanAfricaAlbaniaArgentinaArmeniaAsiaAustraliaAustriaBahamasBangladeshBarbadosBelarusBelgiumBelizeBoliviaBosnia and HerzegovinaBrazilBulgariaBurma/MyanmarCabo VerdeCambodiaCameroonCanadaCaribbeanCentral AmericaChileChinaColombiaCongoCosta RicaCroatiaCubaCzechoslovakiaDenmarkDominicaDominican RepublicEastern AfricaEastern AsiaEastern EuropeEcuadorEgyptEl SalvadorEnglandEritreaEthiopiaEuropeFijiFranceGermanyGhanaGreeceGrenadaGuatemalaGuyanaHaitiHondurasHong KongHungaryIndiaIndonesiaIranIraqIrelandIsraelItalyJamaicaJapanJordanKazakhstanKenyaKoreaKuwaitLaosLatin AmericaLatviaLebanonLiberiaLithuaniaMalaysiaMexicoMicronesiaMiddle AfricaMoldovaMoroccoNepalNetherlandsNicaraguaNigeriaNorth AmericaNorth MacedoniaNorthern AfricaNorthern EuropeNorwayOceaniaPakistanPanamaPeruPhilippinesPolandPortugalRomaniaRussiaSaudi ArabiaScotlandSenegalSerbiaSierra LeoneSingaporeSomaliaSouth AfricaSouth AmericaSouth Central AsiaSouth Eastern AsiaSouthern EuropeSpainSri LankaSt. Vincent and the GrenadinesSwedenSwitzerlandSyriaTaiwanThailandTrinidad and TobagoTurkeyUgandaUkraineUruguayUzbekistanVenezuelaVietnamWest IndiesWestern AfricaWestern AsiaWestern EuropeYemenZaireZimbabweAzores
Self-Care Disability
Income
Poverty
Unemployment
Labor Participation
Family Structure
Vehicle Availability
Education Level
Disability

Immigrants from Sudan Self-Care Disability
Exceptional

2.3%
SELF-CARE DISABILITY
99.8/ 100
METRIC RATING
41st/ 347
METRIC RANK

Immigrants from Sudan Self-Care Disability Correlation Chart

The statistical analysis conducted on geographies consisting of 118,937,078 people shows a slight negative correlation between the proportion of Immigrants from Sudan and percentage of population with self-care disability in the United States with a correlation coefficient (R) of -0.051 and weighted average of 2.3%. On average, for every 1% (one percent) increase in Immigrants from Sudan within a typical geography, there is a decrease of 0.021% in percentage of population with self-care disability.
Immigrants from Sudan Self-Care Disability
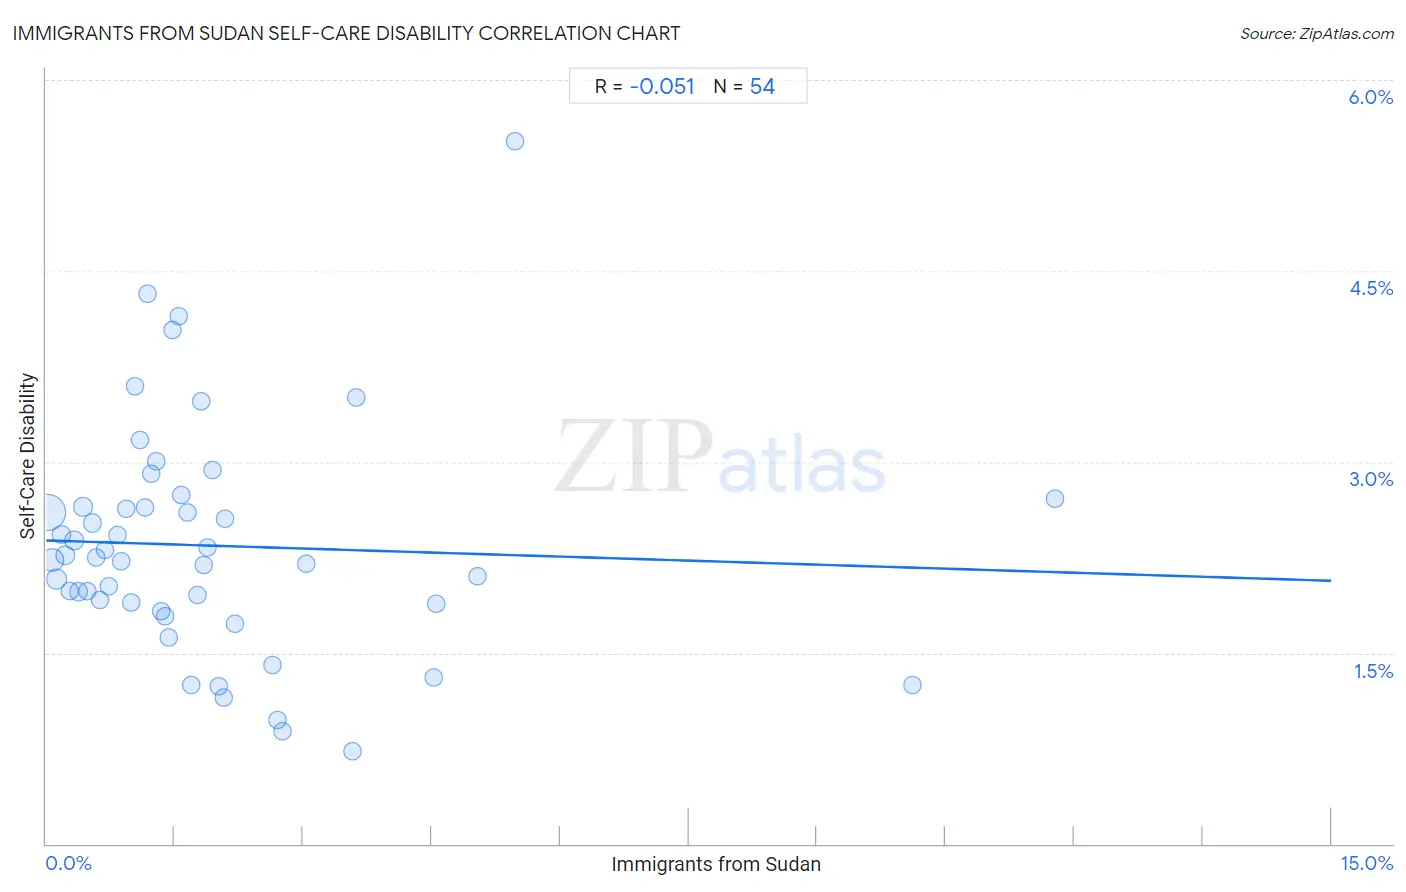
It is essential to understand that the correlation between the percentage of Immigrants from Sudan and percentage of population with self-care disability does not imply a direct cause-and-effect relationship. It remains uncertain whether the presence of Immigrants from Sudan influences an upward or downward trend in the level of percentage of population with self-care disability within an area, or if Immigrants from Sudan simply ended up residing in those areas with higher or lower levels of percentage of population with self-care disability due to other factors.

Demographics Similar to Immigrants from Sudan by Self-Care Disability

In terms of self-care disability, the demographic groups most similar to Immigrants from Sudan are Iranian (2.3%, a difference of 0.070%), Immigrants from Uganda (2.3%, a difference of 0.10%), Immigrants from Bulgaria (2.3%, a difference of 0.11%), Immigrants from Pakistan (2.3%, a difference of 0.14%), and Immigrants from South Africa (2.3%, a difference of 0.19%).
DemographicsRating | RankSelf-Care Disability
Immigrants from Turkey
99.9
/100
|
#34
Exceptional
2.3%
Immigrants from Australia
99.9
/100
|
#35
Exceptional
2.3%
Immigrants from Lithuania
99.9
/100
|
#36
Exceptional
2.3%
Immigrants from Sweden
99.9
/100
|
#37
Exceptional
2.3%
Immigrants from Eastern Africa
99.9
/100
|
#38
Exceptional
2.3%
Immigrants from Bulgaria
99.8
/100
|
#39
Exceptional
2.3%
Iranians
99.8
/100
|
#40
Exceptional
2.3%
Immigrants from Sudan
99.8
/100
|
#41
Exceptional
2.3%
Immigrants from Uganda
99.8
/100
|
#42
Exceptional
2.3%
Immigrants from Pakistan
99.8
/100
|
#43
Exceptional
2.3%
Immigrants from South Africa
99.8
/100
|
#44
Exceptional
2.3%
Norwegians
99.8
/100
|
#45
Exceptional
2.3%
Czechs
99.8
/100
|
#46
Exceptional
2.3%
Jordanians
99.7
/100
|
#47
Exceptional
2.3%
Immigrants from Malaysia
99.7
/100
|
#48
Exceptional
2.3%

Immigrants from Sudan Self-Care Disability Correlation Summary

MeasurementImmigrants from Sudan DataSelf-Care Disability Data
Minimum0.020%0.73%
Maximum11.8%5.5%
Range11.8%4.8%
Mean2.0%2.3%
Median1.4%2.2%
Interquartile 25% (IQ1)0.68%1.9%
Interquartile 75% (IQ3)2.1%2.6%
Interquartile Range (IQR)1.4%0.77%
Standard Deviation (Sample)2.2%0.91%
Standard Deviation (Population)2.2%0.90%

Correlation Details

Immigrants from Sudan PercentileSample SizeSelf-Care Disability
[
0.0%
-
0.5%
]
0.020%
75,067,9442.6%
[
0.0%
-
0.5%
]
0.071%
20,340,1332.2%
[
0.0%
-
0.5%
]
0.12%
7,194,3762.1%
[
0.0%
-
0.5%
]
0.18%
3,781,3822.4%
[
0.0%
-
0.5%
]
0.23%
3,078,1452.3%
[
0.0%
-
0.5%
]
0.28%
2,015,2252.0%
[
0.0%
-
0.5%
]
0.33%
1,522,1682.4%
[
0.0%
-
0.5%
]
0.38%
1,257,4652.0%
[
0.0%
-
0.5%
]
0.43%
630,9792.6%
[
0.0%
-
0.5%
]
0.48%
543,5252.0%
[
0.5%
-
1.0%
]
0.54%
1,024,8782.5%
[
0.5%
-
1.0%
]
0.58%
292,3922.3%
[
0.5%
-
1.0%
]
0.63%
494,0911.9%
[
0.5%
-
1.0%
]
0.68%
119,3792.3%
[
0.5%
-
1.0%
]
0.73%
209,2382.0%
[
0.5%
-
1.0%
]
0.84%
200,5402.4%
[
0.5%
-
1.0%
]
0.88%
66,3032.2%
[
0.5%
-
1.0%
]
0.93%
156,3532.6%
[
0.5%
-
1.0%
]
0.99%
91,7061.9%
[
1.0%
-
1.5%
]
1.03%
36,3733.6%
[
1.0%
-
1.5%
]
1.09%
99,0503.2%
[
1.0%
-
1.5%
]
1.15%
32,2732.6%
[
1.0%
-
1.5%
]
1.19%
5904.3%
[
1.0%
-
1.5%
]
1.23%
75,8272.9%
[
1.0%
-
1.5%
]
1.28%
75,8773.0%
[
1.0%
-
1.5%
]
1.34%
63,7221.8%
[
1.0%
-
1.5%
]
1.39%
14,2961.8%
[
1.0%
-
1.5%
]
1.43%
37,5791.6%
[
1.0%
-
1.5%
]
1.48%
8,1294.0%
[
1.5%
-
2.0%
]
1.55%
2,7764.1%
[
1.5%
-
2.0%
]
1.58%
10,0672.7%
[
1.5%
-
2.0%
]
1.65%
43,0662.6%
[
1.5%
-
2.0%
]
1.70%
90,5701.2%
[
1.5%
-
2.0%
]
1.77%
11,8111.9%
[
1.5%
-
2.0%
]
1.80%
12,7433.5%
[
1.5%
-
2.0%
]
1.85%
17,0702.2%
[
1.5%
-
2.0%
]
1.89%
18,6902.3%
[
1.5%
-
2.0%
]
1.94%
3,5142.9%
[
2.0%
-
2.5%
]
2.01%
20,8341.2%
[
2.0%
-
2.5%
]
2.07%
21,6461.2%
[
2.0%
-
2.5%
]
2.09%
31,9762.6%
[
2.0%
-
2.5%
]
2.20%
40,4181.7%
[
2.5%
-
3.0%
]
2.64%
1,2141.4%
[
2.5%
-
3.0%
]
2.71%
2,5130.97%
[
2.5%
-
3.0%
]
2.75%
2,3240.88%
[
3.0%
-
3.5%
]
3.03%
21,4202.2%
[
3.5%
-
4.0%
]
3.58%
3,4400.73%
[
3.5%
-
4.0%
]
3.62%
10,3803.5%
[
4.5%
-
5.0%
]
4.52%
22,3401.3%
[
4.5%
-
5.0%
]
4.55%
7,2031.9%
[
5.0%
-
5.5%
]
5.03%
6,5162.1%
[
5.0%
-
5.5%
]
5.48%
3475.5%
[
10.0%
-
10.5%
]
10.12%
1,2061.3%
[
11.5%
-
12.0%
]
11.78%
3,0562.7%