Immigrants from Sudan Wage/Income Gap

COMPARE

Immigrants from Sudan
Race
Ancestry
AfghanAfricanAlaska NativeAlaskan AthabascanAlbanianAleutAlsatianAmericanApacheArabArapahoArgentineanArmenianAssyrian/Chaldean/SyriacAustralianAustrianBahamianBangladeshiBarbadianBasqueBelgianBelizeanBermudanBhutaneseBlackfeetBolivianBrazilianBritishBritish West IndianBulgarianBurmeseCajunCambodianCanadianCape VerdeanCarpatho RusynCelticCentral AmericanCentral American IndianCherokeeCheyenneChickasawChileanChineseChippewaChoctawColombianColvilleComancheCosta RicanCreeCreekCroatianCrowCubanCypriotCzechCzechoslovakianDanishDelawareDominicanDutchDutch West IndianEastern EuropeanEcuadorianEgyptianEnglishEstonianEthiopianEuropeanFijianFilipinoFinnishFrenchFrench American IndianFrench CanadianGermanGerman RussianGhanaianGreekGuamanian/ChamorroGuatemalanGuyaneseHaitianHmongHonduranHopiHoumaHungarianIcelanderIndian (Asian)IndonesianInupiatIranianIraqiIrishIroquoisIsraeliItalianJamaicanJapaneseJordanianKenyanKiowaKoreanLaotianLatvianLebaneseLiberianLithuanianLumbeeLuxembourgerMacedonianMalaysianMalteseMarshalleseMenomineeMexicanMexican American IndianMongolianMoroccanNative HawaiianNavajoNepaleseNew ZealanderNicaraguanNigerianNorthern EuropeanNorwegianOkinawanOsageOttawaPaiutePakistaniPalestinianPanamanianParaguayanPennsylvania GermanPeruvianPimaPolishPortuguesePotawatomiPuebloPuerto RicanPuget Sound SalishRomanianRussianSalvadoranSamoanScandinavianScotch-IrishScottishSeminoleSenegaleseSerbianShoshoneSierra LeoneanSiouxSlavicSlovakSloveneSomaliSouth AfricanSouth AmericanSouth American IndianSoviet UnionSpaniardSpanishSpanish AmericanSpanish American IndianSri LankanSubsaharan AfricanSudaneseSwedishSwissSyrianTaiwaneseThaiTlingit-HaidaTohono O'OdhamTonganTrinidadian and TobagonianTsimshianTurkishU.S. Virgin IslanderUgandanUkrainianUruguayanUteVenezuelanVietnameseWelshWest IndianYakamaYaquiYugoslavianYumanYup'ikZimbabwean
Immigration
NonimmigrantsImmigrantsAfghanistanAfricaAlbaniaArgentinaArmeniaAsiaAustraliaAustriaBahamasBangladeshBarbadosBelarusBelgiumBelizeBoliviaBosnia and HerzegovinaBrazilBulgariaBurma/MyanmarCabo VerdeCambodiaCameroonCanadaCaribbeanCentral AmericaChileChinaColombiaCongoCosta RicaCroatiaCubaCzechoslovakiaDenmarkDominicaDominican RepublicEastern AfricaEastern AsiaEastern EuropeEcuadorEgyptEl SalvadorEnglandEritreaEthiopiaEuropeFijiFranceGermanyGhanaGreeceGrenadaGuatemalaGuyanaHaitiHondurasHong KongHungaryIndiaIndonesiaIranIraqIrelandIsraelItalyJamaicaJapanJordanKazakhstanKenyaKoreaKuwaitLaosLatin AmericaLatviaLebanonLiberiaLithuaniaMalaysiaMexicoMicronesiaMiddle AfricaMoldovaMoroccoNepalNetherlandsNicaraguaNigeriaNorth AmericaNorth MacedoniaNorthern AfricaNorthern EuropeNorwayOceaniaPakistanPanamaPeruPhilippinesPolandPortugalRomaniaRussiaSaudi ArabiaScotlandSenegalSerbiaSierra LeoneSingaporeSomaliaSouth AfricaSouth AmericaSouth Central AsiaSouth Eastern AsiaSouthern EuropeSpainSri LankaSt. Vincent and the GrenadinesSudanSwedenSwitzerlandSyriaTaiwanThailandTrinidad and TobagoTurkeyUgandaUkraineUruguayUzbekistanVenezuelaVietnamWest IndiesWestern AfricaWestern AsiaWestern EuropeYemenZaireZimbabweAzores
Select to Compare
Race
Ancestry
AfghanAfricanAlaska NativeAlaskan AthabascanAlbanianAleutAlsatianAmericanApacheArabArapahoArgentineanArmenianAssyrian/Chaldean/SyriacAustralianAustrianBahamianBangladeshiBarbadianBasqueBelgianBelizeanBermudanBhutaneseBlackfeetBolivianBrazilianBritishBritish West IndianBulgarianBurmeseCajunCambodianCanadianCape VerdeanCarpatho RusynCelticCentral AmericanCentral American IndianCherokeeCheyenneChickasawChileanChineseChippewaChoctawColombianColvilleComancheCosta RicanCreeCreekCroatianCrowCubanCypriotCzechCzechoslovakianDanishDelawareDominicanDutchDutch West IndianEastern EuropeanEcuadorianEgyptianEnglishEstonianEthiopianEuropeanFijianFilipinoFinnishFrenchFrench American IndianFrench CanadianGermanGerman RussianGhanaianGreekGuamanian/ChamorroGuatemalanGuyaneseHaitianHmongHonduranHopiHoumaHungarianIcelanderIndian (Asian)IndonesianInupiatIranianIraqiIrishIroquoisIsraeliItalianJamaicanJapaneseJordanianKenyanKiowaKoreanLaotianLatvianLebaneseLiberianLithuanianLumbeeLuxembourgerMacedonianMalaysianMalteseMarshalleseMenomineeMexicanMexican American IndianMongolianMoroccanNative HawaiianNavajoNepaleseNew ZealanderNicaraguanNigerianNorthern EuropeanNorwegianOkinawanOsageOttawaPaiutePakistaniPalestinianPanamanianParaguayanPennsylvania GermanPeruvianPimaPolishPortuguesePotawatomiPuebloPuerto RicanPuget Sound SalishRomanianRussianSalvadoranSamoanScandinavianScotch-IrishScottishSeminoleSenegaleseSerbianShoshoneSierra LeoneanSiouxSlavicSlovakSloveneSomaliSouth AfricanSouth AmericanSouth American IndianSoviet UnionSpaniardSpanishSpanish AmericanSpanish American IndianSri LankanSubsaharan AfricanSudaneseSwedishSwissSyrianTaiwaneseThaiTlingit-HaidaTohono O'OdhamTonganTrinidadian and TobagonianTsimshianTurkishU.S. Virgin IslanderUgandanUkrainianUruguayanUteVenezuelanVietnameseWelshWest IndianYakamaYaquiYugoslavianYumanYup'ikZimbabwean
Immigration
NonimmigrantsImmigrantsAfghanistanAfricaAlbaniaArgentinaArmeniaAsiaAustraliaAustriaBahamasBangladeshBarbadosBelarusBelgiumBelizeBoliviaBosnia and HerzegovinaBrazilBulgariaBurma/MyanmarCabo VerdeCambodiaCameroonCanadaCaribbeanCentral AmericaChileChinaColombiaCongoCosta RicaCroatiaCubaCzechoslovakiaDenmarkDominicaDominican RepublicEastern AfricaEastern AsiaEastern EuropeEcuadorEgyptEl SalvadorEnglandEritreaEthiopiaEuropeFijiFranceGermanyGhanaGreeceGrenadaGuatemalaGuyanaHaitiHondurasHong KongHungaryIndiaIndonesiaIranIraqIrelandIsraelItalyJamaicaJapanJordanKazakhstanKenyaKoreaKuwaitLaosLatin AmericaLatviaLebanonLiberiaLithuaniaMalaysiaMexicoMicronesiaMiddle AfricaMoldovaMoroccoNepalNetherlandsNicaraguaNigeriaNorth AmericaNorth MacedoniaNorthern AfricaNorthern EuropeNorwayOceaniaPakistanPanamaPeruPhilippinesPolandPortugalRomaniaRussiaSaudi ArabiaScotlandSenegalSerbiaSierra LeoneSingaporeSomaliaSouth AfricaSouth AmericaSouth Central AsiaSouth Eastern AsiaSouthern EuropeSpainSri LankaSt. Vincent and the GrenadinesSwedenSwitzerlandSyriaTaiwanThailandTrinidad and TobagoTurkeyUgandaUkraineUruguayUzbekistanVenezuelaVietnamWest IndiesWestern AfricaWestern AsiaWestern EuropeYemenZaireZimbabweAzores
Wage/Income Gap
Income
Poverty
Unemployment
Labor Participation
Family Structure
Vehicle Availability
Education Level
Disability

Immigrants from Sudan Wage/Income Gap
Exceptional

23.6%
WAGE/INCOME GAP
99.4/ 100
METRIC RATING
97th/ 347
METRIC RANK

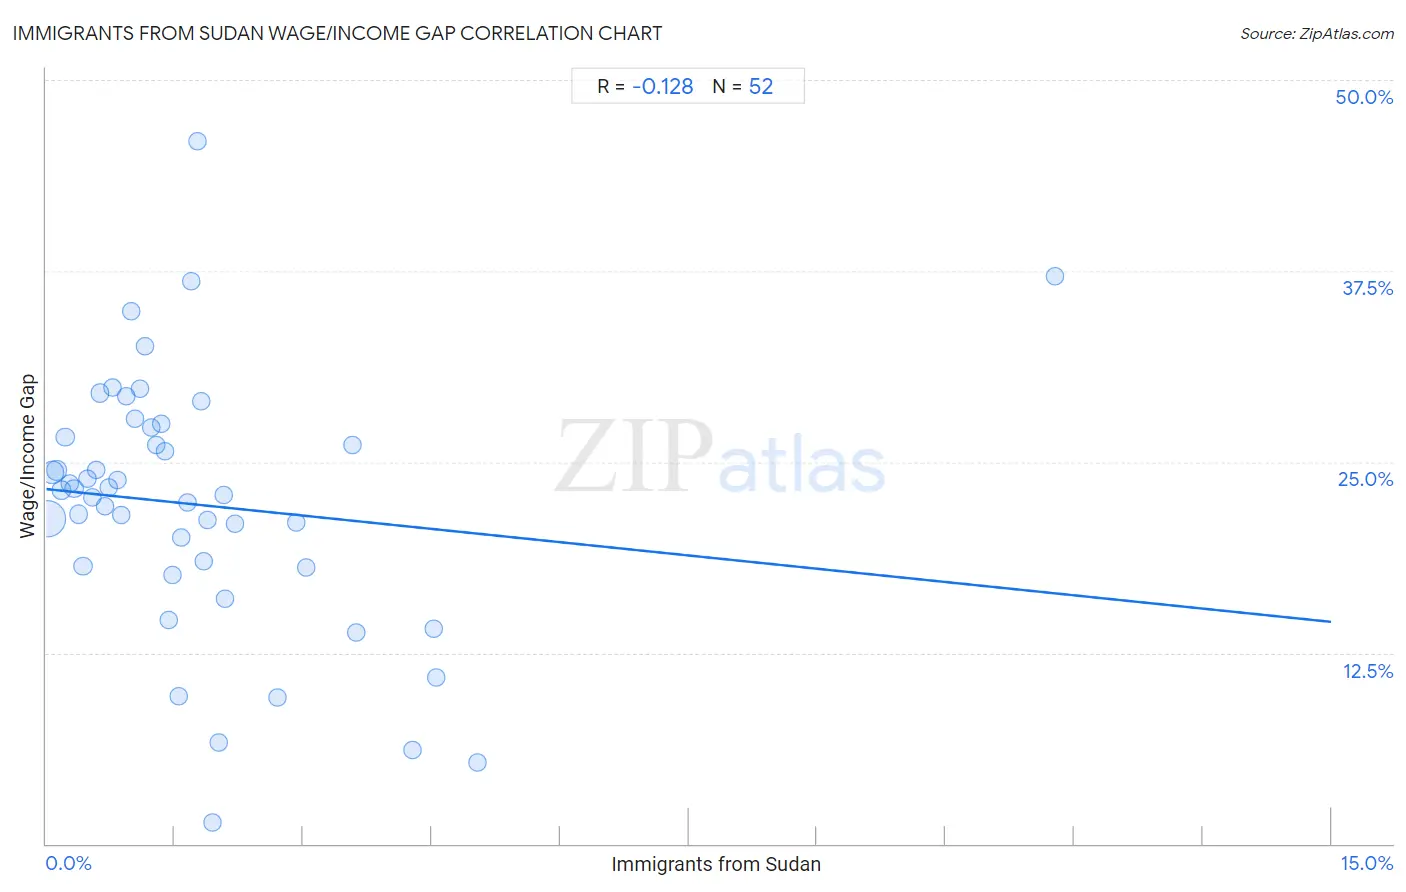
Immigrants from Sudan Wage/Income Gap Correlation Chart

The statistical analysis conducted on geographies consisting of 118,934,661 people shows a poor negative correlation between the proportion of Immigrants from Sudan and wage/income gap percentage in the United States with a correlation coefficient (R) of -0.128 and weighted average of 23.6%. On average, for every 1% (one percent) increase in Immigrants from Sudan within a typical geography, there is a decrease of 0.58% in wage/income gap percentage.
Immigrants from Sudan Wage/Income Gap
It is essential to understand that the correlation between the percentage of Immigrants from Sudan and wage/income gap percentage does not imply a direct cause-and-effect relationship. It remains uncertain whether the presence of Immigrants from Sudan influences an upward or downward trend in the level of wage/income gap percentage within an area, or if Immigrants from Sudan simply ended up residing in those areas with higher or lower levels of wage/income gap percentage due to other factors.

Demographics Similar to Immigrants from Sudan by Wage/Income Gap

In terms of wage/income gap, the demographic groups most similar to Immigrants from Sudan are Kiowa (23.6%, a difference of 0.090%), Cape Verdean (23.6%, a difference of 0.21%), Honduran (23.6%, a difference of 0.24%), Immigrants from Cabo Verde (23.6%, a difference of 0.33%), and Immigrants from Latin America (23.7%, a difference of 0.40%).
DemographicsRating | RankWage/Income Gap
Nicaraguans
99.6
/100
|
#90
Exceptional
23.4%
Arapaho
99.6
/100
|
#91
Exceptional
23.5%
Immigrants from Honduras
99.5
/100
|
#92
Exceptional
23.5%
Immigrants from Cabo Verde
99.5
/100
|
#93
Exceptional
23.6%
Hondurans
99.5
/100
|
#94
Exceptional
23.6%
Cape Verdeans
99.4
/100
|
#95
Exceptional
23.6%
Kiowa
99.4
/100
|
#96
Exceptional
23.6%
Immigrants from Sudan
99.4
/100
|
#97
Exceptional
23.6%
Immigrants from Latin America
99.2
/100
|
#98
Exceptional
23.7%
Aleuts
99.2
/100
|
#99
Exceptional
23.7%
Yakama
99.2
/100
|
#100
Exceptional
23.7%
Japanese
99.1
/100
|
#101
Exceptional
23.8%
Immigrants from Laos
99.0
/100
|
#102
Exceptional
23.8%
Tsimshian
98.9
/100
|
#103
Exceptional
23.9%
Tlingit-Haida
98.7
/100
|
#104
Exceptional
24.0%

Immigrants from Sudan Wage/Income Gap Correlation Summary

MeasurementImmigrants from Sudan DataWage/Income Gap Data
Minimum0.020%1.4%
Maximum11.8%46.0%
Range11.8%44.6%
Mean1.8%22.2%
Median1.4%23.0%
Interquartile 25% (IQ1)0.66%18.1%
Interquartile 75% (IQ3)2.0%26.9%
Interquartile Range (IQR)1.4%8.8%
Standard Deviation (Sample)1.9%8.5%
Standard Deviation (Population)1.9%8.4%

Correlation Details

Immigrants from Sudan PercentileSample SizeWage/Income Gap
[
0.0%
-
0.5%
]
0.020%
75,060,56221.3%
[
0.0%
-
0.5%
]
0.071%
20,340,13324.3%
[
0.0%
-
0.5%
]
0.12%
7,190,42524.5%
[
0.0%
-
0.5%
]
0.18%
3,775,61923.1%
[
0.0%
-
0.5%
]
0.23%
3,078,53726.6%
[
0.0%
-
0.5%
]
0.28%
2,013,11423.6%
[
0.0%
-
0.5%
]
0.33%
1,532,13123.3%
[
0.0%
-
0.5%
]
0.38%
1,264,67821.6%
[
0.0%
-
0.5%
]
0.43%
628,83518.2%
[
0.0%
-
0.5%
]
0.48%
544,13523.9%
[
0.5%
-
1.0%
]
0.54%
1,024,87822.7%
[
0.5%
-
1.0%
]
0.58%
292,39224.5%
[
0.5%
-
1.0%
]
0.63%
494,09129.5%
[
0.5%
-
1.0%
]
0.68%
119,37922.1%
[
0.5%
-
1.0%
]
0.73%
209,23823.3%
[
0.5%
-
1.0%
]
0.78%
2,44029.9%
[
0.5%
-
1.0%
]
0.84%
200,90223.8%
[
0.5%
-
1.0%
]
0.88%
66,30321.5%
[
0.5%
-
1.0%
]
0.93%
156,35329.3%
[
0.5%
-
1.0%
]
0.99%
91,70634.9%
[
1.0%
-
1.5%
]
1.03%
36,37327.9%
[
1.0%
-
1.5%
]
1.09%
99,05029.8%
[
1.0%
-
1.5%
]
1.15%
32,27332.5%
[
1.0%
-
1.5%
]
1.23%
76,47627.2%
[
1.0%
-
1.5%
]
1.28%
75,87726.1%
[
1.0%
-
1.5%
]
1.34%
63,72227.5%
[
1.0%
-
1.5%
]
1.39%
14,29625.7%
[
1.0%
-
1.5%
]
1.43%
37,57914.6%
[
1.0%
-
1.5%
]
1.48%
8,12917.6%
[
1.5%
-
2.0%
]
1.55%
2,7769.7%
[
1.5%
-
2.0%
]
1.58%
10,06720.0%
[
1.5%
-
2.0%
]
1.65%
43,06622.3%
[
1.5%
-
2.0%
]
1.70%
90,57036.9%
[
1.5%
-
2.0%
]
1.77%
11,81146.0%
[
1.5%
-
2.0%
]
1.80%
12,74329.0%
[
1.5%
-
2.0%
]
1.85%
17,07018.5%
[
1.5%
-
2.0%
]
1.89%
18,69021.2%
[
1.5%
-
2.0%
]
1.94%
3,5141.4%
[
2.0%
-
2.5%
]
2.01%
20,8346.6%
[
2.0%
-
2.5%
]
2.07%
21,64622.8%
[
2.0%
-
2.5%
]
2.09%
31,97616.0%
[
2.0%
-
2.5%
]
2.20%
40,41821.0%
[
2.5%
-
3.0%
]
2.71%
2,5139.6%
[
2.5%
-
3.0%
]
2.92%
1,16421.0%
[
3.0%
-
3.5%
]
3.03%
21,42018.1%
[
3.5%
-
4.0%
]
3.58%
3,44026.1%
[
3.5%
-
4.0%
]
3.62%
10,38013.8%
[
4.0%
-
4.5%
]
4.28%
1,8226.1%
[
4.5%
-
5.0%
]
4.52%
22,34014.1%
[
4.5%
-
5.0%
]
4.55%
7,20310.9%
[
5.0%
-
5.5%
]
5.03%
6,5165.4%
[
11.5%
-
12.0%
]
11.78%
3,05637.1%