Immigrants from Sudan 4 or more Vehicles in Household

COMPARE

Immigrants from Sudan
Race
Ancestry
AfghanAfricanAlaska NativeAlaskan AthabascanAlbanianAleutAlsatianAmericanApacheArabArapahoArgentineanArmenianAssyrian/Chaldean/SyriacAustralianAustrianBahamianBangladeshiBarbadianBasqueBelgianBelizeanBermudanBhutaneseBlackfeetBolivianBrazilianBritishBritish West IndianBulgarianBurmeseCajunCambodianCanadianCape VerdeanCarpatho RusynCelticCentral AmericanCentral American IndianCherokeeCheyenneChickasawChileanChineseChippewaChoctawColombianColvilleComancheCosta RicanCreeCreekCroatianCrowCubanCypriotCzechCzechoslovakianDanishDelawareDominicanDutchDutch West IndianEastern EuropeanEcuadorianEgyptianEnglishEstonianEthiopianEuropeanFijianFilipinoFinnishFrenchFrench American IndianFrench CanadianGermanGerman RussianGhanaianGreekGuamanian/ChamorroGuatemalanGuyaneseHaitianHmongHonduranHopiHoumaHungarianIcelanderIndian (Asian)IndonesianInupiatIranianIraqiIrishIroquoisIsraeliItalianJamaicanJapaneseJordanianKenyanKiowaKoreanLaotianLatvianLebaneseLiberianLithuanianLumbeeLuxembourgerMacedonianMalaysianMalteseMarshalleseMenomineeMexicanMexican American IndianMongolianMoroccanNative HawaiianNavajoNepaleseNew ZealanderNicaraguanNigerianNorthern EuropeanNorwegianOkinawanOsageOttawaPaiutePakistaniPalestinianPanamanianParaguayanPennsylvania GermanPeruvianPimaPolishPortuguesePotawatomiPuebloPuerto RicanPuget Sound SalishRomanianRussianSalvadoranSamoanScandinavianScotch-IrishScottishSeminoleSenegaleseSerbianShoshoneSierra LeoneanSiouxSlavicSlovakSloveneSomaliSouth AfricanSouth AmericanSouth American IndianSoviet UnionSpaniardSpanishSpanish AmericanSpanish American IndianSri LankanSubsaharan AfricanSudaneseSwedishSwissSyrianTaiwaneseThaiTlingit-HaidaTohono O'OdhamTonganTrinidadian and TobagonianTsimshianTurkishU.S. Virgin IslanderUgandanUkrainianUruguayanUteVenezuelanVietnameseWelshWest IndianYakamaYaquiYugoslavianYumanYup'ikZimbabwean
Immigration
NonimmigrantsImmigrantsAfghanistanAfricaAlbaniaArgentinaArmeniaAsiaAustraliaAustriaBahamasBangladeshBarbadosBelarusBelgiumBelizeBoliviaBosnia and HerzegovinaBrazilBulgariaBurma/MyanmarCabo VerdeCambodiaCameroonCanadaCaribbeanCentral AmericaChileChinaColombiaCongoCosta RicaCroatiaCubaCzechoslovakiaDenmarkDominicaDominican RepublicEastern AfricaEastern AsiaEastern EuropeEcuadorEgyptEl SalvadorEnglandEritreaEthiopiaEuropeFijiFranceGermanyGhanaGreeceGrenadaGuatemalaGuyanaHaitiHondurasHong KongHungaryIndiaIndonesiaIranIraqIrelandIsraelItalyJamaicaJapanJordanKazakhstanKenyaKoreaKuwaitLaosLatin AmericaLatviaLebanonLiberiaLithuaniaMalaysiaMexicoMicronesiaMiddle AfricaMoldovaMoroccoNepalNetherlandsNicaraguaNigeriaNorth AmericaNorth MacedoniaNorthern AfricaNorthern EuropeNorwayOceaniaPakistanPanamaPeruPhilippinesPolandPortugalRomaniaRussiaSaudi ArabiaScotlandSenegalSerbiaSierra LeoneSingaporeSomaliaSouth AfricaSouth AmericaSouth Central AsiaSouth Eastern AsiaSouthern EuropeSpainSri LankaSt. Vincent and the GrenadinesSudanSwedenSwitzerlandSyriaTaiwanThailandTrinidad and TobagoTurkeyUgandaUkraineUruguayUzbekistanVenezuelaVietnamWest IndiesWestern AfricaWestern AsiaWestern EuropeYemenZaireZimbabweAzores
Select to Compare
Race
Ancestry
AfghanAfricanAlaska NativeAlaskan AthabascanAlbanianAleutAlsatianAmericanApacheArabArapahoArgentineanArmenianAssyrian/Chaldean/SyriacAustralianAustrianBahamianBangladeshiBarbadianBasqueBelgianBelizeanBermudanBhutaneseBlackfeetBolivianBrazilianBritishBritish West IndianBulgarianBurmeseCajunCambodianCanadianCape VerdeanCarpatho RusynCelticCentral AmericanCentral American IndianCherokeeCheyenneChickasawChileanChineseChippewaChoctawColombianColvilleComancheCosta RicanCreeCreekCroatianCrowCubanCypriotCzechCzechoslovakianDanishDelawareDominicanDutchDutch West IndianEastern EuropeanEcuadorianEgyptianEnglishEstonianEthiopianEuropeanFijianFilipinoFinnishFrenchFrench American IndianFrench CanadianGermanGerman RussianGhanaianGreekGuamanian/ChamorroGuatemalanGuyaneseHaitianHmongHonduranHopiHoumaHungarianIcelanderIndian (Asian)IndonesianInupiatIranianIraqiIrishIroquoisIsraeliItalianJamaicanJapaneseJordanianKenyanKiowaKoreanLaotianLatvianLebaneseLiberianLithuanianLumbeeLuxembourgerMacedonianMalaysianMalteseMarshalleseMenomineeMexicanMexican American IndianMongolianMoroccanNative HawaiianNavajoNepaleseNew ZealanderNicaraguanNigerianNorthern EuropeanNorwegianOkinawanOsageOttawaPaiutePakistaniPalestinianPanamanianParaguayanPennsylvania GermanPeruvianPimaPolishPortuguesePotawatomiPuebloPuerto RicanPuget Sound SalishRomanianRussianSalvadoranSamoanScandinavianScotch-IrishScottishSeminoleSenegaleseSerbianShoshoneSierra LeoneanSiouxSlavicSlovakSloveneSomaliSouth AfricanSouth AmericanSouth American IndianSoviet UnionSpaniardSpanishSpanish AmericanSpanish American IndianSri LankanSubsaharan AfricanSudaneseSwedishSwissSyrianTaiwaneseThaiTlingit-HaidaTohono O'OdhamTonganTrinidadian and TobagonianTsimshianTurkishU.S. Virgin IslanderUgandanUkrainianUruguayanUteVenezuelanVietnameseWelshWest IndianYakamaYaquiYugoslavianYumanYup'ikZimbabwean
Immigration
NonimmigrantsImmigrantsAfghanistanAfricaAlbaniaArgentinaArmeniaAsiaAustraliaAustriaBahamasBangladeshBarbadosBelarusBelgiumBelizeBoliviaBosnia and HerzegovinaBrazilBulgariaBurma/MyanmarCabo VerdeCambodiaCameroonCanadaCaribbeanCentral AmericaChileChinaColombiaCongoCosta RicaCroatiaCubaCzechoslovakiaDenmarkDominicaDominican RepublicEastern AfricaEastern AsiaEastern EuropeEcuadorEgyptEl SalvadorEnglandEritreaEthiopiaEuropeFijiFranceGermanyGhanaGreeceGrenadaGuatemalaGuyanaHaitiHondurasHong KongHungaryIndiaIndonesiaIranIraqIrelandIsraelItalyJamaicaJapanJordanKazakhstanKenyaKoreaKuwaitLaosLatin AmericaLatviaLebanonLiberiaLithuaniaMalaysiaMexicoMicronesiaMiddle AfricaMoldovaMoroccoNepalNetherlandsNicaraguaNigeriaNorth AmericaNorth MacedoniaNorthern AfricaNorthern EuropeNorwayOceaniaPakistanPanamaPeruPhilippinesPolandPortugalRomaniaRussiaSaudi ArabiaScotlandSenegalSerbiaSierra LeoneSingaporeSomaliaSouth AfricaSouth AmericaSouth Central AsiaSouth Eastern AsiaSouthern EuropeSpainSri LankaSt. Vincent and the GrenadinesSwedenSwitzerlandSyriaTaiwanThailandTrinidad and TobagoTurkeyUgandaUkraineUruguayUzbekistanVenezuelaVietnamWest IndiesWestern AfricaWestern AsiaWestern EuropeYemenZaireZimbabweAzores
4 or more Vehicles in Household
Income
Poverty
Unemployment
Labor Participation
Family Structure
Vehicle Availability
Education Level
Disability

Immigrants from Sudan 4 or more Vehicles in Household
Tragic

5.5%
4+ VEHICLES AVAILABLE
0.6/ 100
METRIC RATING
271st/ 347
METRIC RANK

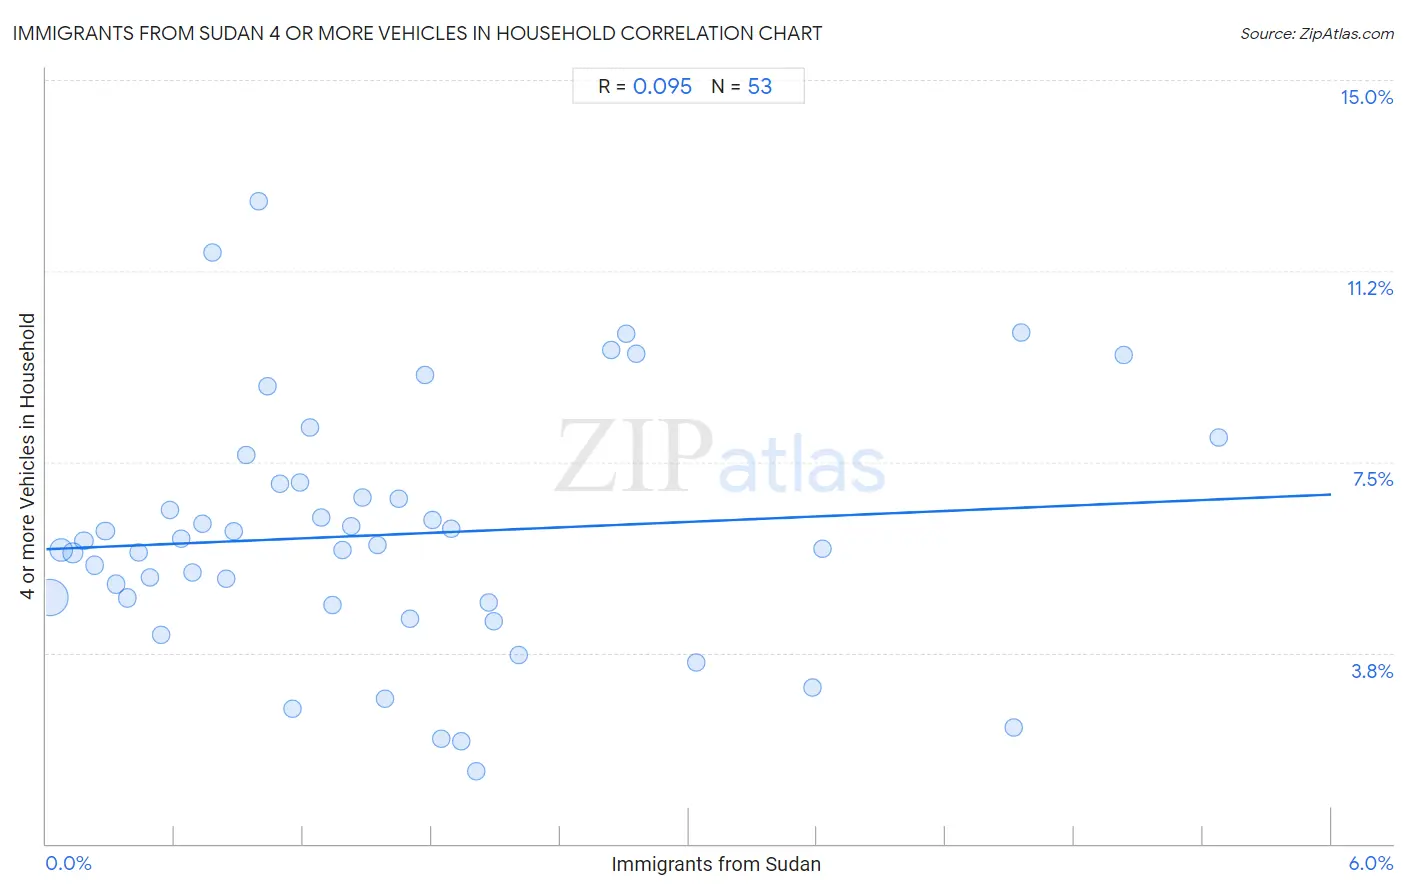
Immigrants from Sudan 4 or more Vehicles in Household Correlation Chart

The statistical analysis conducted on geographies consisting of 118,789,653 people shows a slight positive correlation between the proportion of Immigrants from Sudan and percentage of households with 4 or more vehicles available in the United States with a correlation coefficient (R) of 0.095 and weighted average of 5.5%. On average, for every 1% (one percent) increase in Immigrants from Sudan within a typical geography, there is an increase of 0.18% in percentage of households with 4 or more vehicles available.
Immigrants from Sudan 4 or more Vehicles in Household
It is essential to understand that the correlation between the percentage of Immigrants from Sudan and percentage of households with 4 or more vehicles available does not imply a direct cause-and-effect relationship. It remains uncertain whether the presence of Immigrants from Sudan influences an upward or downward trend in the level of percentage of households with 4 or more vehicles available within an area, or if Immigrants from Sudan simply ended up residing in those areas with higher or lower levels of percentage of households with 4 or more vehicles available due to other factors.

Demographics Similar to Immigrants from Sudan by 4 or more Vehicles in Household

In terms of 4 or more vehicles in household, the demographic groups most similar to Immigrants from Sudan are Okinawan (5.5%, a difference of 0.10%), Immigrants from Kazakhstan (5.5%, a difference of 0.19%), Macedonian (5.5%, a difference of 0.23%), Carpatho Rusyn (5.5%, a difference of 0.30%), and Black/African American (5.5%, a difference of 0.35%).
DemographicsRating | Rank4 or more Vehicles in Household
Immigrants from Africa
1.0
/100
|
#264
Tragic
5.6%
South Americans
0.9
/100
|
#265
Tragic
5.6%
Immigrants from Nepal
0.9
/100
|
#266
Tragic
5.6%
Immigrants from Ukraine
0.9
/100
|
#267
Tragic
5.6%
Colombians
0.7
/100
|
#268
Tragic
5.5%
Carpatho Rusyns
0.7
/100
|
#269
Tragic
5.5%
Okinawans
0.6
/100
|
#270
Tragic
5.5%
Immigrants from Sudan
0.6
/100
|
#271
Tragic
5.5%
Immigrants from Kazakhstan
0.6
/100
|
#272
Tragic
5.5%
Macedonians
0.6
/100
|
#273
Tragic
5.5%
Blacks/African Americans
0.6
/100
|
#274
Tragic
5.5%
Cambodians
0.5
/100
|
#275
Tragic
5.5%
Immigrants from Latvia
0.5
/100
|
#276
Tragic
5.5%
Immigrants from Bulgaria
0.5
/100
|
#277
Tragic
5.5%
Immigrants from Eastern Europe
0.4
/100
|
#278
Tragic
5.4%

Immigrants from Sudan 4 or more Vehicles in Household Correlation Summary

MeasurementImmigrants from Sudan Data4 or more Vehicles in Household Data
Minimum0.020%1.4%
Maximum5.5%12.6%
Range5.5%11.2%
Mean1.6%6.1%
Median1.3%5.9%
Interquartile 25% (IQ1)0.66%4.7%
Interquartile 75% (IQ3)2.0%7.1%
Interquartile Range (IQR)1.4%2.4%
Standard Deviation (Sample)1.3%2.4%
Standard Deviation (Population)1.3%2.4%

Correlation Details

Immigrants from Sudan PercentileSample Size4 or more Vehicles in Household
[
0.0%
-
0.5%
]
0.020%
75,058,1124.8%
[
0.0%
-
0.5%
]
0.071%
20,298,3345.8%
[
0.0%
-
0.5%
]
0.12%
7,179,0385.7%
[
0.0%
-
0.5%
]
0.18%
3,757,5215.9%
[
0.0%
-
0.5%
]
0.23%
3,078,1455.5%
[
0.0%
-
0.5%
]
0.28%
1,999,0536.1%
[
0.0%
-
0.5%
]
0.33%
1,522,1685.1%
[
0.0%
-
0.5%
]
0.38%
1,243,0584.8%
[
0.0%
-
0.5%
]
0.43%
628,3505.7%
[
0.0%
-
0.5%
]
0.48%
523,5825.2%
[
0.5%
-
1.0%
]
0.54%
1,024,4904.1%
[
0.5%
-
1.0%
]
0.58%
292,3926.6%
[
0.5%
-
1.0%
]
0.63%
494,0916.0%
[
0.5%
-
1.0%
]
0.68%
119,3795.3%
[
0.5%
-
1.0%
]
0.73%
209,2386.3%
[
0.5%
-
1.0%
]
0.78%
2,44011.6%
[
0.5%
-
1.0%
]
0.84%
200,9025.2%
[
0.5%
-
1.0%
]
0.88%
66,3036.1%
[
0.5%
-
1.0%
]
0.93%
156,3537.6%
[
0.5%
-
1.0%
]
0.99%
91,70612.6%
[
1.0%
-
1.5%
]
1.03%
36,3739.0%
[
1.0%
-
1.5%
]
1.09%
99,0507.1%
[
1.0%
-
1.5%
]
1.15%
32,2732.6%
[
1.0%
-
1.5%
]
1.19%
5907.1%
[
1.0%
-
1.5%
]
1.23%
76,4768.2%
[
1.0%
-
1.5%
]
1.28%
75,8776.4%
[
1.0%
-
1.5%
]
1.34%
63,7224.7%
[
1.0%
-
1.5%
]
1.39%
14,2965.8%
[
1.0%
-
1.5%
]
1.43%
37,5796.2%
[
1.0%
-
1.5%
]
1.48%
5,8846.8%
[
1.5%
-
2.0%
]
1.55%
2,7765.9%
[
1.5%
-
2.0%
]
1.58%
10,0672.9%
[
1.5%
-
2.0%
]
1.65%
43,0666.8%
[
1.5%
-
2.0%
]
1.70%
90,5704.4%
[
1.5%
-
2.0%
]
1.77%
11,8119.2%
[
1.5%
-
2.0%
]
1.80%
12,7436.3%
[
1.5%
-
2.0%
]
1.85%
17,0702.1%
[
1.5%
-
2.0%
]
1.89%
18,6906.2%
[
1.5%
-
2.0%
]
1.94%
3,5142.0%
[
2.0%
-
2.5%
]
2.01%
20,8341.4%
[
2.0%
-
2.5%
]
2.07%
21,6464.7%
[
2.0%
-
2.5%
]
2.09%
31,9764.4%
[
2.0%
-
2.5%
]
2.20%
40,4183.7%
[
2.5%
-
3.0%
]
2.64%
1,2149.7%
[
2.5%
-
3.0%
]
2.71%
2,51310.0%
[
2.5%
-
3.0%
]
2.75%
2,3249.6%
[
3.0%
-
3.5%
]
3.03%
21,4203.6%
[
3.5%
-
4.0%
]
3.58%
3,4403.1%
[
3.5%
-
4.0%
]
3.62%
10,3805.8%
[
4.5%
-
5.0%
]
4.52%
22,3402.3%
[
4.5%
-
5.0%
]
4.55%
7,20310.1%
[
5.0%
-
5.5%
]
5.03%
6,5169.6%
[
5.0%
-
5.5%
]
5.48%
3478.0%