Immigrants from Sudan Married-Couple Family Poverty

COMPARE

Immigrants from Sudan
Race
Ancestry
AfghanAfricanAlaska NativeAlaskan AthabascanAlbanianAleutAlsatianAmericanApacheArabArapahoArgentineanArmenianAssyrian/Chaldean/SyriacAustralianAustrianBahamianBangladeshiBarbadianBasqueBelgianBelizeanBermudanBhutaneseBlackfeetBolivianBrazilianBritishBritish West IndianBulgarianBurmeseCajunCambodianCanadianCape VerdeanCarpatho RusynCelticCentral AmericanCentral American IndianCherokeeCheyenneChickasawChileanChineseChippewaChoctawColombianColvilleComancheCosta RicanCreeCreekCroatianCrowCubanCypriotCzechCzechoslovakianDanishDelawareDominicanDutchDutch West IndianEastern EuropeanEcuadorianEgyptianEnglishEstonianEthiopianEuropeanFijianFilipinoFinnishFrenchFrench American IndianFrench CanadianGermanGerman RussianGhanaianGreekGuamanian/ChamorroGuatemalanGuyaneseHaitianHmongHonduranHopiHoumaHungarianIcelanderIndian (Asian)IndonesianInupiatIranianIraqiIrishIroquoisIsraeliItalianJamaicanJapaneseJordanianKenyanKiowaKoreanLaotianLatvianLebaneseLiberianLithuanianLumbeeLuxembourgerMacedonianMalaysianMalteseMarshalleseMenomineeMexicanMexican American IndianMongolianMoroccanNative HawaiianNavajoNepaleseNew ZealanderNicaraguanNigerianNorthern EuropeanNorwegianOkinawanOsageOttawaPaiutePakistaniPalestinianPanamanianParaguayanPennsylvania GermanPeruvianPimaPolishPortuguesePotawatomiPuebloPuerto RicanPuget Sound SalishRomanianRussianSalvadoranSamoanScandinavianScotch-IrishScottishSeminoleSenegaleseSerbianShoshoneSierra LeoneanSiouxSlavicSlovakSloveneSomaliSouth AfricanSouth AmericanSouth American IndianSoviet UnionSpaniardSpanishSpanish AmericanSpanish American IndianSri LankanSubsaharan AfricanSudaneseSwedishSwissSyrianTaiwaneseThaiTlingit-HaidaTohono O'OdhamTonganTrinidadian and TobagonianTsimshianTurkishU.S. Virgin IslanderUgandanUkrainianUruguayanUteVenezuelanVietnameseWelshWest IndianYakamaYaquiYugoslavianYumanYup'ikZimbabwean
Immigration
NonimmigrantsImmigrantsAfghanistanAfricaAlbaniaArgentinaArmeniaAsiaAustraliaAustriaBahamasBangladeshBarbadosBelarusBelgiumBelizeBoliviaBosnia and HerzegovinaBrazilBulgariaBurma/MyanmarCabo VerdeCambodiaCameroonCanadaCaribbeanCentral AmericaChileChinaColombiaCongoCosta RicaCroatiaCubaCzechoslovakiaDenmarkDominicaDominican RepublicEastern AfricaEastern AsiaEastern EuropeEcuadorEgyptEl SalvadorEnglandEritreaEthiopiaEuropeFijiFranceGermanyGhanaGreeceGrenadaGuatemalaGuyanaHaitiHondurasHong KongHungaryIndiaIndonesiaIranIraqIrelandIsraelItalyJamaicaJapanJordanKazakhstanKenyaKoreaKuwaitLaosLatin AmericaLatviaLebanonLiberiaLithuaniaMalaysiaMexicoMicronesiaMiddle AfricaMoldovaMoroccoNepalNetherlandsNicaraguaNigeriaNorth AmericaNorth MacedoniaNorthern AfricaNorthern EuropeNorwayOceaniaPakistanPanamaPeruPhilippinesPolandPortugalRomaniaRussiaSaudi ArabiaScotlandSenegalSerbiaSierra LeoneSingaporeSomaliaSouth AfricaSouth AmericaSouth Central AsiaSouth Eastern AsiaSouthern EuropeSpainSri LankaSt. Vincent and the GrenadinesSudanSwedenSwitzerlandSyriaTaiwanThailandTrinidad and TobagoTurkeyUgandaUkraineUruguayUzbekistanVenezuelaVietnamWest IndiesWestern AfricaWestern AsiaWestern EuropeYemenZaireZimbabweAzores
Select to Compare
Race
Ancestry
AfghanAfricanAlaska NativeAlaskan AthabascanAlbanianAleutAlsatianAmericanApacheArabArapahoArgentineanArmenianAssyrian/Chaldean/SyriacAustralianAustrianBahamianBangladeshiBarbadianBasqueBelgianBelizeanBermudanBhutaneseBlackfeetBolivianBrazilianBritishBritish West IndianBulgarianBurmeseCajunCambodianCanadianCape VerdeanCarpatho RusynCelticCentral AmericanCentral American IndianCherokeeCheyenneChickasawChileanChineseChippewaChoctawColombianColvilleComancheCosta RicanCreeCreekCroatianCrowCubanCypriotCzechCzechoslovakianDanishDelawareDominicanDutchDutch West IndianEastern EuropeanEcuadorianEgyptianEnglishEstonianEthiopianEuropeanFijianFilipinoFinnishFrenchFrench American IndianFrench CanadianGermanGerman RussianGhanaianGreekGuamanian/ChamorroGuatemalanGuyaneseHaitianHmongHonduranHopiHoumaHungarianIcelanderIndian (Asian)IndonesianInupiatIranianIraqiIrishIroquoisIsraeliItalianJamaicanJapaneseJordanianKenyanKiowaKoreanLaotianLatvianLebaneseLiberianLithuanianLumbeeLuxembourgerMacedonianMalaysianMalteseMarshalleseMenomineeMexicanMexican American IndianMongolianMoroccanNative HawaiianNavajoNepaleseNew ZealanderNicaraguanNigerianNorthern EuropeanNorwegianOkinawanOsageOttawaPaiutePakistaniPalestinianPanamanianParaguayanPennsylvania GermanPeruvianPimaPolishPortuguesePotawatomiPuebloPuerto RicanPuget Sound SalishRomanianRussianSalvadoranSamoanScandinavianScotch-IrishScottishSeminoleSenegaleseSerbianShoshoneSierra LeoneanSiouxSlavicSlovakSloveneSomaliSouth AfricanSouth AmericanSouth American IndianSoviet UnionSpaniardSpanishSpanish AmericanSpanish American IndianSri LankanSubsaharan AfricanSudaneseSwedishSwissSyrianTaiwaneseThaiTlingit-HaidaTohono O'OdhamTonganTrinidadian and TobagonianTsimshianTurkishU.S. Virgin IslanderUgandanUkrainianUruguayanUteVenezuelanVietnameseWelshWest IndianYakamaYaquiYugoslavianYumanYup'ikZimbabwean
Immigration
NonimmigrantsImmigrantsAfghanistanAfricaAlbaniaArgentinaArmeniaAsiaAustraliaAustriaBahamasBangladeshBarbadosBelarusBelgiumBelizeBoliviaBosnia and HerzegovinaBrazilBulgariaBurma/MyanmarCabo VerdeCambodiaCameroonCanadaCaribbeanCentral AmericaChileChinaColombiaCongoCosta RicaCroatiaCubaCzechoslovakiaDenmarkDominicaDominican RepublicEastern AfricaEastern AsiaEastern EuropeEcuadorEgyptEl SalvadorEnglandEritreaEthiopiaEuropeFijiFranceGermanyGhanaGreeceGrenadaGuatemalaGuyanaHaitiHondurasHong KongHungaryIndiaIndonesiaIranIraqIrelandIsraelItalyJamaicaJapanJordanKazakhstanKenyaKoreaKuwaitLaosLatin AmericaLatviaLebanonLiberiaLithuaniaMalaysiaMexicoMicronesiaMiddle AfricaMoldovaMoroccoNepalNetherlandsNicaraguaNigeriaNorth AmericaNorth MacedoniaNorthern AfricaNorthern EuropeNorwayOceaniaPakistanPanamaPeruPhilippinesPolandPortugalRomaniaRussiaSaudi ArabiaScotlandSenegalSerbiaSierra LeoneSingaporeSomaliaSouth AfricaSouth AmericaSouth Central AsiaSouth Eastern AsiaSouthern EuropeSpainSri LankaSt. Vincent and the GrenadinesSwedenSwitzerlandSyriaTaiwanThailandTrinidad and TobagoTurkeyUgandaUkraineUruguayUzbekistanVenezuelaVietnamWest IndiesWestern AfricaWestern AsiaWestern EuropeYemenZaireZimbabweAzores
Married-Couple Family Poverty
Income
Poverty
Unemployment
Labor Participation
Family Structure
Vehicle Availability
Education Level
Disability

Immigrants from Sudan Married-Couple Family Poverty
Tragic

5.7%
POVERTY | MARRIED-COUPLE FAMILIES
3.5/ 100
METRIC RATING
235th/ 347
METRIC RANK

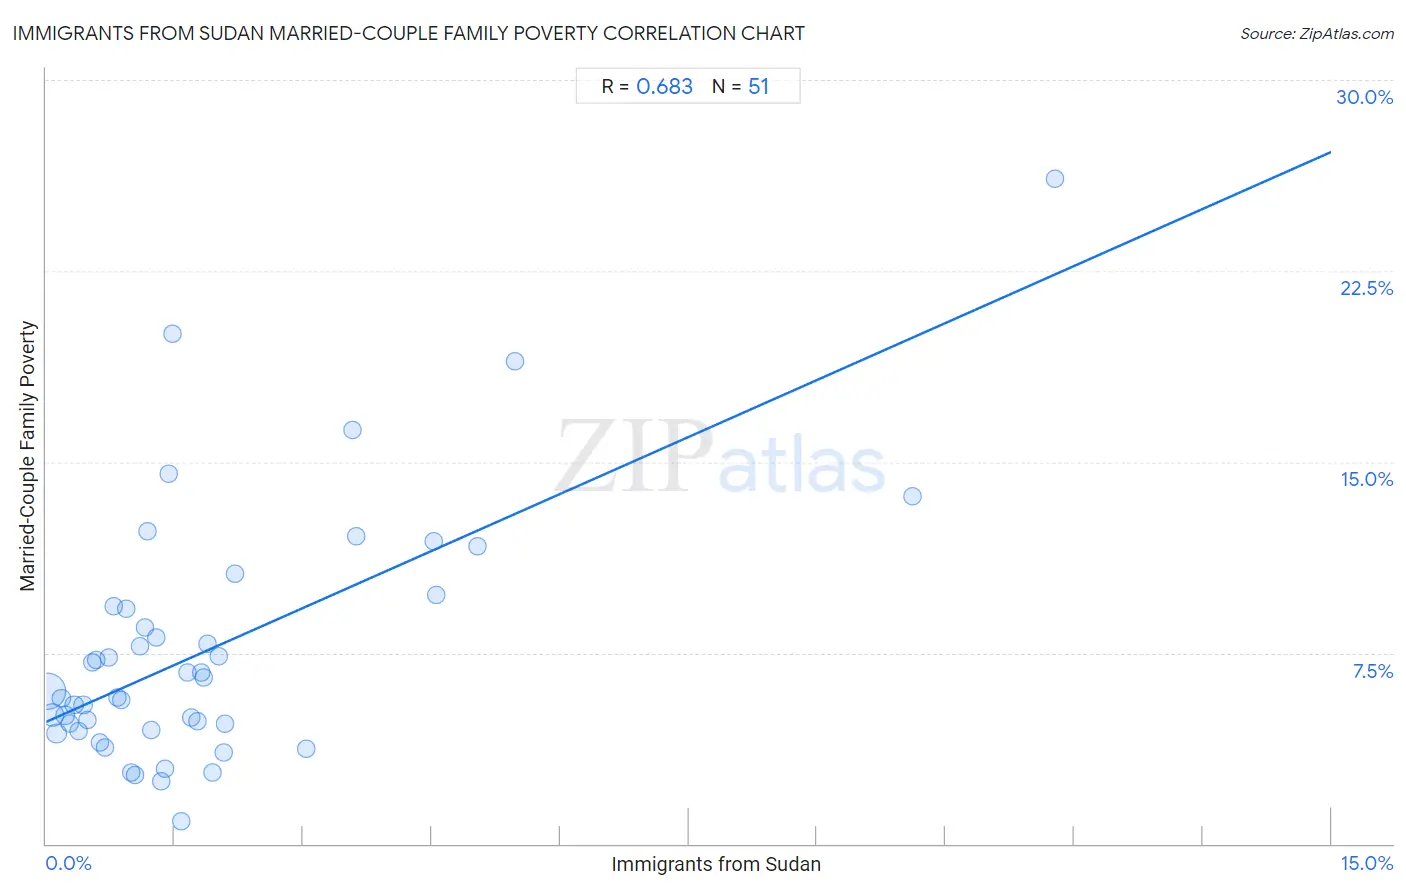
Immigrants from Sudan Married-Couple Family Poverty Correlation Chart

The statistical analysis conducted on geographies consisting of 118,776,869 people shows a significant positive correlation between the proportion of Immigrants from Sudan and poverty level among married-couple families in the United States with a correlation coefficient (R) of 0.683 and weighted average of 5.7%. On average, for every 1% (one percent) increase in Immigrants from Sudan within a typical geography, there is an increase of 1.5% in poverty level among married-couple families.
Immigrants from Sudan Married-Couple Family Poverty
It is essential to understand that the correlation between the percentage of Immigrants from Sudan and poverty level among married-couple families does not imply a direct cause-and-effect relationship. It remains uncertain whether the presence of Immigrants from Sudan influences an upward or downward trend in the level of poverty level among married-couple families within an area, or if Immigrants from Sudan simply ended up residing in those areas with higher or lower levels of poverty level among married-couple families due to other factors.

Demographics Similar to Immigrants from Sudan by Married-Couple Family Poverty

In terms of married-couple family poverty, the demographic groups most similar to Immigrants from Sudan are Ghanaian (5.7%, a difference of 0.16%), Immigrants from Colombia (5.7%, a difference of 0.19%), Immigrants from Uruguay (5.7%, a difference of 0.19%), Immigrants from South America (5.7%, a difference of 0.32%), and Immigrants from Laos (5.7%, a difference of 0.63%).
DemographicsRating | RankMarried-Couple Family Poverty
Arabs
5.4
/100
|
#228
Tragic
5.7%
Sub-Saharan Africans
4.9
/100
|
#229
Tragic
5.7%
Moroccans
4.9
/100
|
#230
Tragic
5.7%
Immigrants from Iraq
4.4
/100
|
#231
Tragic
5.7%
Immigrants from Laos
4.4
/100
|
#232
Tragic
5.7%
Immigrants from Colombia
3.7
/100
|
#233
Tragic
5.7%
Immigrants from Uruguay
3.7
/100
|
#234
Tragic
5.7%
Immigrants from Sudan
3.5
/100
|
#235
Tragic
5.7%
Ghanaians
3.3
/100
|
#236
Tragic
5.7%
Immigrants from South America
3.1
/100
|
#237
Tragic
5.7%
Cherokee
2.7
/100
|
#238
Tragic
5.8%
Venezuelans
2.7
/100
|
#239
Tragic
5.8%
Fijians
2.5
/100
|
#240
Tragic
5.8%
Immigrants from Panama
2.5
/100
|
#241
Tragic
5.8%
Immigrants from Western Africa
2.4
/100
|
#242
Tragic
5.8%

Immigrants from Sudan Married-Couple Family Poverty Correlation Summary

MeasurementImmigrants from Sudan DataMarried-Couple Family Poverty Data
Minimum0.020%0.91%
Maximum11.8%26.1%
Range11.8%25.2%
Mean1.9%7.6%
Median1.3%6.0%
Interquartile 25% (IQ1)0.63%4.5%
Interquartile 75% (IQ3)2.0%9.3%
Interquartile Range (IQR)1.4%4.9%
Standard Deviation (Sample)2.3%4.9%
Standard Deviation (Population)2.2%4.9%

Correlation Details

Immigrants from Sudan PercentileSample SizeMarried-Couple Family Poverty
[
0.0%
-
0.5%
]
0.020%
75,060,7916.0%
[
0.0%
-
0.5%
]
0.071%
20,327,9835.1%
[
0.0%
-
0.5%
]
0.12%
7,152,2514.3%
[
0.0%
-
0.5%
]
0.18%
3,777,9645.7%
[
0.0%
-
0.5%
]
0.23%
3,067,3205.0%
[
0.0%
-
0.5%
]
0.28%
2,011,6524.7%
[
0.0%
-
0.5%
]
0.33%
1,522,1685.5%
[
0.0%
-
0.5%
]
0.38%
1,255,2754.4%
[
0.0%
-
0.5%
]
0.43%
622,9085.4%
[
0.0%
-
0.5%
]
0.48%
534,4894.8%
[
0.5%
-
1.0%
]
0.54%
1,024,8787.1%
[
0.5%
-
1.0%
]
0.58%
286,5347.2%
[
0.5%
-
1.0%
]
0.63%
494,0914.0%
[
0.5%
-
1.0%
]
0.68%
113,4973.8%
[
0.5%
-
1.0%
]
0.73%
209,2387.3%
[
0.5%
-
1.0%
]
0.78%
1,6609.3%
[
0.5%
-
1.0%
]
0.84%
200,9025.7%
[
0.5%
-
1.0%
]
0.88%
62,4825.7%
[
0.5%
-
1.0%
]
0.93%
156,3539.2%
[
0.5%
-
1.0%
]
0.99%
82,6192.8%
[
1.0%
-
1.5%
]
1.03%
36,3732.7%
[
1.0%
-
1.5%
]
1.09%
99,0507.8%
[
1.0%
-
1.5%
]
1.15%
32,2738.5%
[
1.0%
-
1.5%
]
1.19%
59012.3%
[
1.0%
-
1.5%
]
1.23%
76,4764.5%
[
1.0%
-
1.5%
]
1.28%
75,4178.1%
[
1.0%
-
1.5%
]
1.34%
42,2272.5%
[
1.0%
-
1.5%
]
1.39%
14,2962.9%
[
1.0%
-
1.5%
]
1.43%
36,96014.5%
[
1.0%
-
1.5%
]
1.48%
8,12920.0%
[
1.5%
-
2.0%
]
1.58%
10,0670.91%
[
1.5%
-
2.0%
]
1.65%
43,0666.7%
[
1.5%
-
2.0%
]
1.70%
90,5705.0%
[
1.5%
-
2.0%
]
1.77%
11,8114.8%
[
1.5%
-
2.0%
]
1.80%
12,7436.8%
[
1.5%
-
2.0%
]
1.85%
17,0706.5%
[
1.5%
-
2.0%
]
1.89%
12,8827.8%
[
1.5%
-
2.0%
]
1.94%
3,5142.8%
[
2.0%
-
2.5%
]
2.01%
19,5317.3%
[
2.0%
-
2.5%
]
2.07%
21,6463.6%
[
2.0%
-
2.5%
]
2.09%
31,9764.7%
[
2.0%
-
2.5%
]
2.20%
39,23910.6%
[
3.0%
-
3.5%
]
3.03%
21,4203.7%
[
3.5%
-
4.0%
]
3.58%
3,44016.2%
[
3.5%
-
4.0%
]
3.62%
10,38012.1%
[
4.5%
-
5.0%
]
4.52%
22,34011.9%
[
4.5%
-
5.0%
]
4.55%
7,2039.8%
[
5.0%
-
5.5%
]
5.03%
6,51611.7%
[
5.0%
-
5.5%
]
5.48%
34719.0%
[
10.0%
-
10.5%
]
10.12%
1,20613.6%
[
11.5%
-
12.0%
]
11.78%
3,05626.1%