Immigrants from South America Self-Care Disability
COMPARE
Immigrants from South America
Select to Compare
Self-Care Disability
Immigrants from South America Self-Care Disability
2.4%
SELF-CARE DISABILITY
88.8/ 100
METRIC RATING
132nd/ 347
METRIC RANK
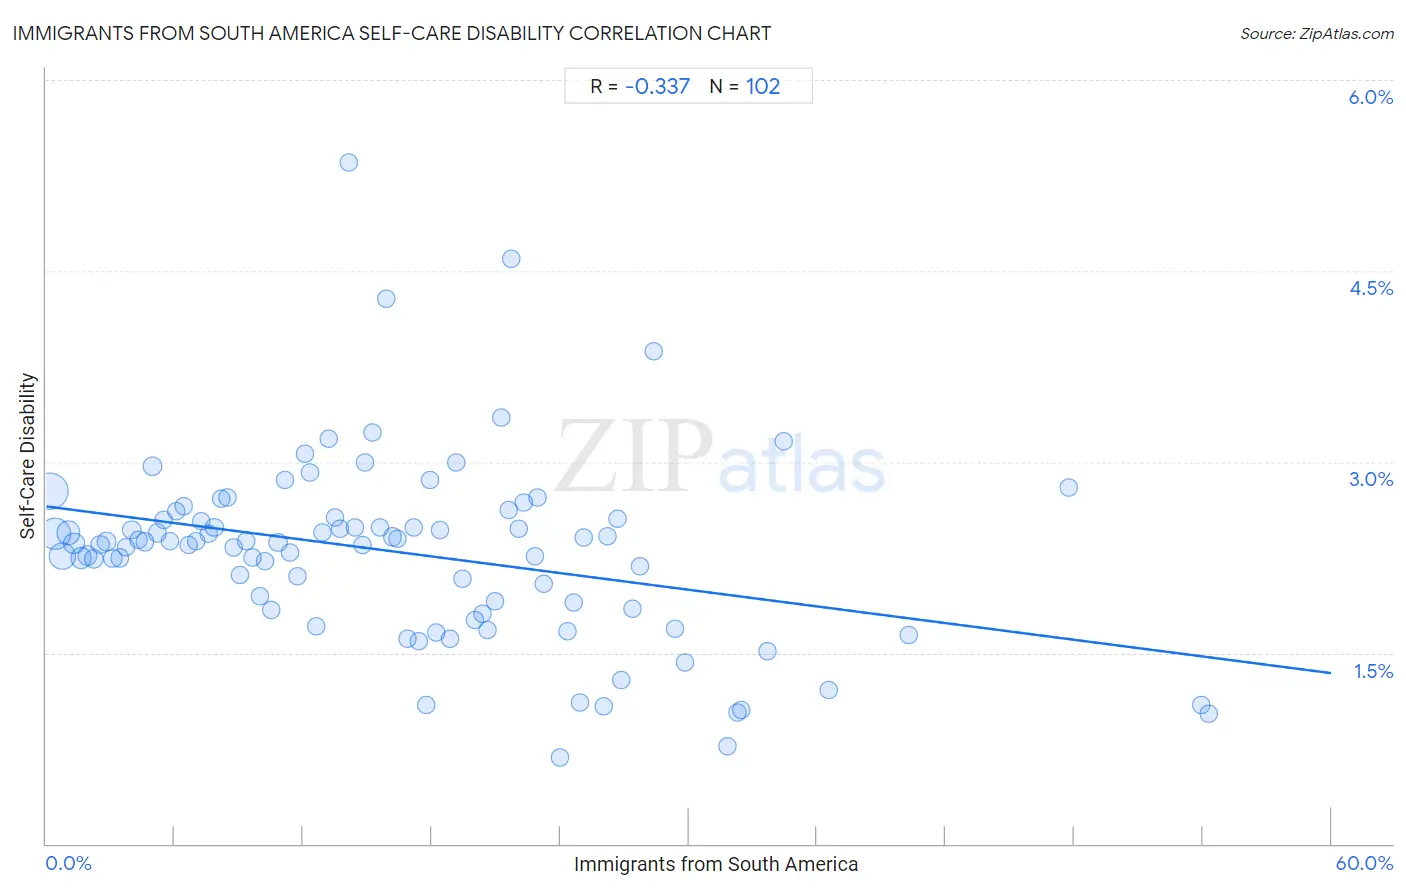
Immigrants from South America Self-Care Disability Correlation Chart
The statistical analysis conducted on geographies consisting of 485,509,375 people shows a mild negative correlation between the proportion of Immigrants from South America and percentage of population with self-care disability in the United States with a correlation coefficient (R) of -0.337 and weighted average of 2.4%. On average, for every 1% (one percent) increase in Immigrants from South America within a typical geography, there is a decrease of 0.022% in percentage of population with self-care disability.
It is essential to understand that the correlation between the percentage of Immigrants from South America and percentage of population with self-care disability does not imply a direct cause-and-effect relationship. It remains uncertain whether the presence of Immigrants from South America influences an upward or downward trend in the level of percentage of population with self-care disability within an area, or if Immigrants from South America simply ended up residing in those areas with higher or lower levels of percentage of population with self-care disability due to other factors.
Demographics Similar to Immigrants from South America by Self-Care Disability
In terms of self-care disability, the demographic groups most similar to Immigrants from South America are Polish (2.4%, a difference of 0.010%), Immigrants from Austria (2.4%, a difference of 0.030%), Immigrants from Colombia (2.4%, a difference of 0.030%), Immigrants from Romania (2.4%, a difference of 0.050%), and Russian (2.4%, a difference of 0.070%).
| Demographics | Rating | Rank | Self-Care Disability |
| Hmong | 89.9 /100 | #126 | Excellent 2.4% |
| Colombians | 89.7 /100 | #127 | Excellent 2.4% |
| Immigrants from Hungary | 89.6 /100 | #128 | Excellent 2.4% |
| Immigrants from Romania | 89.3 /100 | #129 | Excellent 2.4% |
| Immigrants from Austria | 89.0 /100 | #130 | Excellent 2.4% |
| Poles | 88.9 /100 | #131 | Excellent 2.4% |
| Immigrants from South America | 88.8 /100 | #132 | Excellent 2.4% |
| Immigrants from Colombia | 88.5 /100 | #133 | Excellent 2.4% |
| Russians | 88.2 /100 | #134 | Excellent 2.4% |
| Laotians | 87.8 /100 | #135 | Excellent 2.4% |
| South American Indians | 87.2 /100 | #136 | Excellent 2.4% |
| Austrians | 87.0 /100 | #137 | Excellent 2.4% |
| Immigrants from Croatia | 86.6 /100 | #138 | Excellent 2.4% |
| Sri Lankans | 86.6 /100 | #139 | Excellent 2.4% |
Immigrants from South America Self-Care Disability Correlation Summary
| Measurement | Immigrants from South America Data | Self-Care Disability Data |
| Minimum | 0.15% | 0.67% |
| Maximum | 54.3% | 5.3% |
| Range | 54.1% | 4.7% |
| Mean | 16.4% | 2.3% |
| Median | 15.1% | 2.4% |
| Interquartile 25% (IQ1) | 7.6% | 1.8% |
| Interquartile 75% (IQ3) | 22.9% | 2.5% |
| Interquartile Range (IQR) | 15.4% | 0.70% |
| Standard Deviation (Sample) | 11.3% | 0.73% |
| Standard Deviation (Population) | 11.3% | 0.73% |
Correlation Details
| Immigrants from South America Percentile | Sample Size | Self-Care Disability |
[ 0.0% - 0.5% ] 0.15% | 141,641,051 | 2.8% |
[ 0.0% - 0.5% ] 0.43% | 103,530,441 | 2.4% |
[ 0.5% - 1.0% ] 0.74% | 67,916,005 | 2.3% |
[ 1.0% - 1.5% ] 1.04% | 43,615,678 | 2.4% |
[ 1.0% - 1.5% ] 1.31% | 23,813,107 | 2.4% |
[ 1.5% - 2.0% ] 1.63% | 20,416,215 | 2.2% |
[ 1.5% - 2.0% ] 1.93% | 10,526,406 | 2.3% |
[ 2.0% - 2.5% ] 2.23% | 8,828,357 | 2.2% |
[ 2.5% - 3.0% ] 2.51% | 7,335,480 | 2.4% |
[ 2.5% - 3.0% ] 2.81% | 4,496,643 | 2.4% |
[ 3.0% - 3.5% ] 3.11% | 5,310,111 | 2.2% |
[ 3.0% - 3.5% ] 3.42% | 3,437,315 | 2.2% |
[ 3.5% - 4.0% ] 3.72% | 3,783,221 | 2.3% |
[ 3.5% - 4.0% ] 4.00% | 2,617,869 | 2.5% |
[ 4.0% - 4.5% ] 4.32% | 2,538,362 | 2.4% |
[ 4.5% - 5.0% ] 4.61% | 1,965,010 | 2.4% |
[ 4.5% - 5.0% ] 4.98% | 9,728,638 | 3.0% |
[ 5.0% - 5.5% ] 5.19% | 2,140,633 | 2.4% |
[ 5.0% - 5.5% ] 5.49% | 1,373,047 | 2.5% |
[ 5.5% - 6.0% ] 5.77% | 1,258,742 | 2.4% |
[ 6.0% - 6.5% ] 6.08% | 959,770 | 2.6% |
[ 6.0% - 6.5% ] 6.40% | 617,706 | 2.6% |
[ 6.5% - 7.0% ] 6.65% | 1,086,855 | 2.4% |
[ 6.5% - 7.0% ] 6.98% | 795,393 | 2.4% |
[ 7.0% - 7.5% ] 7.24% | 647,722 | 2.5% |
[ 7.5% - 8.0% ] 7.56% | 751,249 | 2.4% |
[ 7.5% - 8.0% ] 7.85% | 492,040 | 2.5% |
[ 8.0% - 8.5% ] 8.16% | 708,537 | 2.7% |
[ 8.0% - 8.5% ] 8.45% | 685,450 | 2.7% |
[ 8.5% - 9.0% ] 8.75% | 617,001 | 2.3% |
[ 9.0% - 9.5% ] 9.02% | 474,971 | 2.1% |
[ 9.0% - 9.5% ] 9.36% | 701,194 | 2.4% |
[ 9.5% - 10.0% ] 9.64% | 309,111 | 2.3% |
[ 9.5% - 10.0% ] 9.95% | 576,680 | 1.9% |
[ 10.0% - 10.5% ] 10.24% | 460,392 | 2.2% |
[ 10.5% - 11.0% ] 10.53% | 629,631 | 1.8% |
[ 10.5% - 11.0% ] 10.83% | 608,884 | 2.4% |
[ 11.0% - 11.5% ] 11.13% | 762,251 | 2.9% |
[ 11.0% - 11.5% ] 11.38% | 269,406 | 2.3% |
[ 11.5% - 12.0% ] 11.73% | 185,516 | 2.1% |
[ 12.0% - 12.5% ] 12.07% | 132,773 | 3.1% |
[ 12.0% - 12.5% ] 12.33% | 352,655 | 2.9% |
[ 12.5% - 13.0% ] 12.60% | 75,163 | 1.7% |
[ 12.5% - 13.0% ] 12.88% | 621,821 | 2.4% |
[ 13.0% - 13.5% ] 13.17% | 595,606 | 3.2% |
[ 13.0% - 13.5% ] 13.50% | 406,867 | 2.6% |
[ 13.5% - 14.0% ] 13.74% | 98,069 | 2.5% |
[ 14.0% - 14.5% ] 14.15% | 20,258 | 5.3% |
[ 14.0% - 14.5% ] 14.43% | 178,189 | 2.5% |
[ 14.5% - 15.0% ] 14.74% | 365,630 | 2.3% |
[ 14.5% - 15.0% ] 14.90% | 199,113 | 3.0% |
[ 15.0% - 15.5% ] 15.21% | 58,536 | 3.2% |
[ 15.5% - 16.0% ] 15.59% | 161,299 | 2.5% |
[ 15.5% - 16.0% ] 15.90% | 167,210 | 4.3% |
[ 16.0% - 16.5% ] 16.15% | 397,983 | 2.4% |
[ 16.0% - 16.5% ] 16.39% | 197,932 | 2.4% |
[ 16.5% - 17.0% ] 16.85% | 128,146 | 1.6% |
[ 17.0% - 17.5% ] 17.15% | 173,635 | 2.5% |
[ 17.0% - 17.5% ] 17.39% | 143,078 | 1.6% |
[ 17.5% - 18.0% ] 17.72% | 34,922 | 1.1% |
[ 17.5% - 18.0% ] 17.93% | 116,676 | 2.9% |
[ 18.0% - 18.5% ] 18.22% | 13,503 | 1.7% |
[ 18.0% - 18.5% ] 18.41% | 79,484 | 2.5% |
[ 18.5% - 19.0% ] 18.84% | 141,348 | 1.6% |
[ 19.0% - 19.5% ] 19.16% | 199,419 | 3.0% |
[ 19.0% - 19.5% ] 19.42% | 288,403 | 2.1% |
[ 19.5% - 20.0% ] 19.99% | 65,589 | 1.8% |
[ 20.0% - 20.5% ] 20.36% | 33,160 | 1.8% |
[ 20.5% - 21.0% ] 20.62% | 93,099 | 1.7% |
[ 20.5% - 21.0% ] 20.93% | 117,896 | 1.9% |
[ 21.0% - 21.5% ] 21.26% | 69,714 | 3.4% |
[ 21.5% - 22.0% ] 21.59% | 117,157 | 2.6% |
[ 21.5% - 22.0% ] 21.72% | 2,408 | 4.6% |
[ 22.0% - 22.5% ] 22.04% | 99,813 | 2.5% |
[ 22.0% - 22.5% ] 22.30% | 3,435 | 2.7% |
[ 22.5% - 23.0% ] 22.80% | 89,531 | 2.3% |
[ 22.5% - 23.0% ] 22.94% | 9,176 | 2.7% |
[ 23.0% - 23.5% ] 23.23% | 57,066 | 2.0% |
[ 24.0% - 24.5% ] 24.01% | 17,136 | 0.67% |
[ 24.0% - 24.5% ] 24.32% | 21,935 | 1.7% |
[ 24.5% - 25.0% ] 24.63% | 35,967 | 1.9% |
[ 24.5% - 25.0% ] 24.91% | 15,184 | 1.1% |
[ 25.0% - 25.5% ] 25.12% | 45,457 | 2.4% |
[ 26.0% - 26.5% ] 26.05% | 11,809 | 1.1% |
[ 26.0% - 26.5% ] 26.23% | 42,058 | 2.4% |
[ 26.5% - 27.0% ] 26.68% | 40,106 | 2.5% |
[ 26.5% - 27.0% ] 26.82% | 44,742 | 1.3% |
[ 27.0% - 27.5% ] 27.39% | 16,450 | 1.8% |
[ 27.5% - 28.0% ] 27.70% | 39,067 | 2.2% |
[ 28.0% - 28.5% ] 28.39% | 155 | 3.9% |
[ 29.0% - 29.5% ] 29.39% | 51,153 | 1.7% |
[ 29.5% - 30.0% ] 29.82% | 23,734 | 1.4% |
[ 31.5% - 32.0% ] 31.82% | 5,843 | 0.77% |
[ 32.0% - 32.5% ] 32.25% | 17,450 | 1.0% |
[ 32.0% - 32.5% ] 32.43% | 16,333 | 1.1% |
[ 33.5% - 34.0% ] 33.70% | 99,543 | 1.5% |
[ 34.0% - 34.5% ] 34.45% | 48,096 | 3.2% |
[ 36.5% - 37.0% ] 36.55% | 249 | 1.2% |
[ 40.0% - 40.5% ] 40.26% | 56,696 | 1.6% |
[ 47.5% - 48.0% ] 47.76% | 2,718 | 2.8% |
[ 53.5% - 54.0% ] 53.91% | 64,751 | 1.1% |
[ 54.0% - 54.5% ] 54.26% | 74,891 | 1.0% |