Immigrants from South America Married-couple Households
COMPARE
Immigrants from South America
Select to Compare
Married-couple Households
Immigrants from South America Married-couple Households
45.9%
MARRIED-COUPLE HOUSEHOLDS
22.2/ 100
METRIC RATING
196th/ 347
METRIC RANK
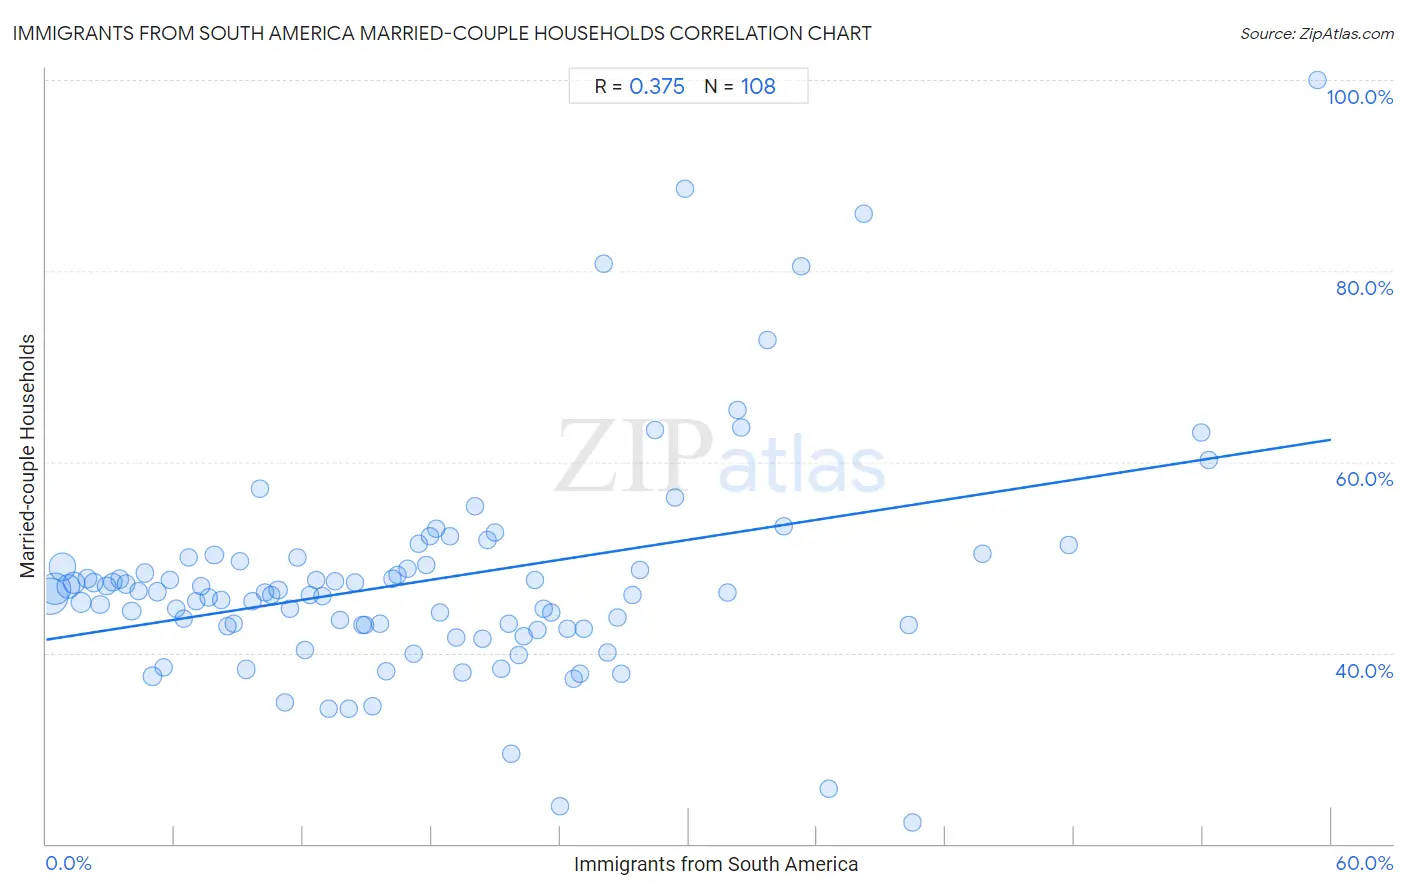
Immigrants from South America Married-couple Households Correlation Chart
The statistical analysis conducted on geographies consisting of 486,013,684 people shows a mild positive correlation between the proportion of Immigrants from South America and percentage of married-couple family households in the United States with a correlation coefficient (R) of 0.375 and weighted average of 45.9%. On average, for every 1% (one percent) increase in Immigrants from South America within a typical geography, there is an increase of 0.35% in percentage of married-couple family households.
It is essential to understand that the correlation between the percentage of Immigrants from South America and percentage of married-couple family households does not imply a direct cause-and-effect relationship. It remains uncertain whether the presence of Immigrants from South America influences an upward or downward trend in the level of percentage of married-couple family households within an area, or if Immigrants from South America simply ended up residing in those areas with higher or lower levels of percentage of married-couple family households due to other factors.
Demographics Similar to Immigrants from South America by Married-couple Households
In terms of married-couple households, the demographic groups most similar to Immigrants from South America are Chickasaw (45.9%, a difference of 0.030%), Cambodian (45.9%, a difference of 0.050%), Mexican American Indian (45.9%, a difference of 0.060%), Taiwanese (45.9%, a difference of 0.070%), and Immigrants from Northern Africa (46.0%, a difference of 0.13%).
| Demographics | Rating | Rank | Married-couple Households |
| Immigrants from Latvia | 26.9 /100 | #189 | Fair 46.0% |
| Immigrants from Kuwait | 25.6 /100 | #190 | Fair 46.0% |
| Choctaw | 24.9 /100 | #191 | Fair 46.0% |
| Immigrants from Northern Africa | 24.6 /100 | #192 | Fair 46.0% |
| Taiwanese | 23.4 /100 | #193 | Fair 45.9% |
| Mexican American Indians | 23.3 /100 | #194 | Fair 45.9% |
| Chickasaw | 22.7 /100 | #195 | Fair 45.9% |
| Immigrants from South America | 22.2 /100 | #196 | Fair 45.9% |
| Cambodians | 21.3 /100 | #197 | Fair 45.9% |
| Ottawa | 19.4 /100 | #198 | Poor 45.8% |
| Carpatho Rusyns | 15.7 /100 | #199 | Poor 45.7% |
| Potawatomi | 15.6 /100 | #200 | Poor 45.7% |
| Immigrants from Serbia | 15.2 /100 | #201 | Poor 45.7% |
| Immigrants from Central America | 14.2 /100 | #202 | Poor 45.7% |
| Alaska Natives | 13.0 /100 | #203 | Poor 45.6% |
Immigrants from South America Married-couple Households Correlation Summary
| Measurement | Immigrants from South America Data | Married-couple Households Data |
| Minimum | 0.15% | 22.2% |
| Maximum | 59.4% | 100.0% |
| Range | 59.2% | 77.8% |
| Mean | 17.7% | 47.6% |
| Median | 16.0% | 46.2% |
| Interquartile 25% (IQ1) | 8.0% | 42.7% |
| Interquartile 75% (IQ3) | 24.5% | 49.4% |
| Interquartile Range (IQR) | 16.5% | 6.7% |
| Standard Deviation (Sample) | 12.5% | 11.7% |
| Standard Deviation (Population) | 12.5% | 11.6% |
Correlation Details
| Immigrants from South America Percentile | Sample Size | Married-couple Households |
[ 0.0% - 0.5% ] 0.15% | 141,743,777 | 45.9% |
[ 0.0% - 0.5% ] 0.43% | 103,580,678 | 46.7% |
[ 0.5% - 1.0% ] 0.74% | 68,018,105 | 49.0% |
[ 1.0% - 1.5% ] 1.04% | 43,640,995 | 47.0% |
[ 1.0% - 1.5% ] 1.31% | 23,852,178 | 47.3% |
[ 1.5% - 2.0% ] 1.63% | 20,439,878 | 45.2% |
[ 1.5% - 2.0% ] 1.93% | 10,550,466 | 47.7% |
[ 2.0% - 2.5% ] 2.23% | 8,858,086 | 47.4% |
[ 2.5% - 3.0% ] 2.51% | 7,357,727 | 45.1% |
[ 2.5% - 3.0% ] 2.81% | 4,512,354 | 47.0% |
[ 3.0% - 3.5% ] 3.11% | 5,322,038 | 47.4% |
[ 3.0% - 3.5% ] 3.42% | 3,440,272 | 47.7% |
[ 3.5% - 4.0% ] 3.72% | 3,792,384 | 47.2% |
[ 3.5% - 4.0% ] 4.00% | 2,623,809 | 44.4% |
[ 4.0% - 4.5% ] 4.32% | 2,540,073 | 46.4% |
[ 4.5% - 5.0% ] 4.61% | 1,966,866 | 48.3% |
[ 4.5% - 5.0% ] 4.98% | 9,733,008 | 37.5% |
[ 5.0% - 5.5% ] 5.19% | 2,142,418 | 46.4% |
[ 5.0% - 5.5% ] 5.49% | 1,373,846 | 38.4% |
[ 5.5% - 6.0% ] 5.77% | 1,262,152 | 47.6% |
[ 6.0% - 6.5% ] 6.08% | 961,443 | 44.6% |
[ 6.0% - 6.5% ] 6.40% | 620,941 | 43.6% |
[ 6.5% - 7.0% ] 6.65% | 1,087,543 | 50.0% |
[ 6.5% - 7.0% ] 6.98% | 799,948 | 45.4% |
[ 7.0% - 7.5% ] 7.24% | 649,716 | 47.0% |
[ 7.5% - 8.0% ] 7.56% | 751,556 | 45.8% |
[ 7.5% - 8.0% ] 7.85% | 491,964 | 50.3% |
[ 8.0% - 8.5% ] 8.16% | 708,537 | 45.5% |
[ 8.0% - 8.5% ] 8.45% | 686,486 | 42.8% |
[ 8.5% - 9.0% ] 8.75% | 618,925 | 43.0% |
[ 9.0% - 9.5% ] 9.02% | 476,574 | 49.6% |
[ 9.0% - 9.5% ] 9.36% | 701,531 | 38.3% |
[ 9.5% - 10.0% ] 9.64% | 309,679 | 45.4% |
[ 9.5% - 10.0% ] 9.95% | 576,680 | 57.2% |
[ 10.0% - 10.5% ] 10.24% | 460,392 | 46.3% |
[ 10.5% - 11.0% ] 10.53% | 629,631 | 46.1% |
[ 10.5% - 11.0% ] 10.83% | 609,778 | 46.6% |
[ 11.0% - 11.5% ] 11.13% | 762,305 | 34.9% |
[ 11.0% - 11.5% ] 11.38% | 269,406 | 44.6% |
[ 11.5% - 12.0% ] 11.73% | 185,575 | 50.0% |
[ 12.0% - 12.5% ] 12.07% | 133,032 | 40.3% |
[ 12.0% - 12.5% ] 12.33% | 352,769 | 46.0% |
[ 12.5% - 13.0% ] 12.60% | 75,163 | 47.7% |
[ 12.5% - 13.0% ] 12.88% | 622,188 | 46.0% |
[ 13.0% - 13.5% ] 13.17% | 596,054 | 34.2% |
[ 13.0% - 13.5% ] 13.50% | 406,867 | 47.4% |
[ 13.5% - 14.0% ] 13.74% | 97,814 | 43.4% |
[ 14.0% - 14.5% ] 14.15% | 20,322 | 34.1% |
[ 14.0% - 14.5% ] 14.43% | 178,189 | 47.4% |
[ 14.5% - 15.0% ] 14.74% | 365,719 | 42.9% |
[ 14.5% - 15.0% ] 14.90% | 200,678 | 43.0% |
[ 15.0% - 15.5% ] 15.21% | 58,536 | 34.3% |
[ 15.5% - 16.0% ] 15.59% | 161,299 | 43.0% |
[ 15.5% - 16.0% ] 15.90% | 167,210 | 38.1% |
[ 16.0% - 16.5% ] 16.15% | 398,137 | 47.7% |
[ 16.0% - 16.5% ] 16.39% | 197,932 | 48.1% |
[ 16.5% - 17.0% ] 16.85% | 128,146 | 48.8% |
[ 17.0% - 17.5% ] 17.15% | 173,635 | 39.9% |
[ 17.0% - 17.5% ] 17.39% | 143,461 | 51.4% |
[ 17.5% - 18.0% ] 17.72% | 34,922 | 49.2% |
[ 17.5% - 18.0% ] 17.93% | 116,676 | 52.2% |
[ 18.0% - 18.5% ] 18.22% | 13,503 | 53.0% |
[ 18.0% - 18.5% ] 18.41% | 79,484 | 44.3% |
[ 18.5% - 19.0% ] 18.84% | 141,348 | 52.3% |
[ 19.0% - 19.5% ] 19.16% | 199,419 | 41.6% |
[ 19.0% - 19.5% ] 19.42% | 288,444 | 38.0% |
[ 19.5% - 20.0% ] 19.99% | 65,589 | 55.4% |
[ 20.0% - 20.5% ] 20.36% | 33,160 | 41.4% |
[ 20.5% - 21.0% ] 20.62% | 93,099 | 51.8% |
[ 20.5% - 21.0% ] 20.93% | 117,896 | 52.6% |
[ 21.0% - 21.5% ] 21.26% | 69,714 | 38.3% |
[ 21.5% - 22.0% ] 21.59% | 117,157 | 43.1% |
[ 21.5% - 22.0% ] 21.72% | 2,408 | 29.5% |
[ 22.0% - 22.5% ] 22.04% | 99,813 | 39.8% |
[ 22.0% - 22.5% ] 22.30% | 3,435 | 41.7% |
[ 22.5% - 23.0% ] 22.80% | 89,531 | 47.7% |
[ 22.5% - 23.0% ] 22.94% | 9,176 | 42.4% |
[ 23.0% - 23.5% ] 23.23% | 57,066 | 44.7% |
[ 23.5% - 24.0% ] 23.56% | 191 | 44.3% |
[ 24.0% - 24.5% ] 24.01% | 17,136 | 23.9% |
[ 24.0% - 24.5% ] 24.32% | 22,204 | 42.5% |
[ 24.5% - 25.0% ] 24.63% | 35,967 | 37.3% |
[ 24.5% - 25.0% ] 24.91% | 15,184 | 37.8% |
[ 25.0% - 25.5% ] 25.12% | 45,457 | 42.5% |
[ 26.0% - 26.5% ] 26.05% | 11,809 | 80.7% |
[ 26.0% - 26.5% ] 26.23% | 42,058 | 40.1% |
[ 26.5% - 27.0% ] 26.68% | 40,106 | 43.7% |
[ 26.5% - 27.0% ] 26.82% | 44,742 | 37.8% |
[ 27.0% - 27.5% ] 27.39% | 16,450 | 46.1% |
[ 27.5% - 28.0% ] 27.70% | 39,225 | 48.7% |
[ 28.0% - 28.5% ] 28.45% | 703 | 63.3% |
[ 29.0% - 29.5% ] 29.39% | 51,153 | 56.3% |
[ 29.5% - 30.0% ] 29.82% | 23,734 | 88.5% |
[ 31.5% - 32.0% ] 31.82% | 5,843 | 46.3% |
[ 32.0% - 32.5% ] 32.25% | 17,450 | 65.4% |
[ 32.0% - 32.5% ] 32.43% | 16,333 | 63.7% |
[ 33.5% - 34.0% ] 33.70% | 99,543 | 72.7% |
[ 34.0% - 34.5% ] 34.45% | 48,096 | 53.2% |
[ 35.0% - 35.5% ] 35.23% | 88 | 80.5% |
[ 36.5% - 37.0% ] 36.55% | 249 | 25.8% |
[ 38.0% - 38.5% ] 38.15% | 249 | 86.0% |
[ 40.0% - 40.5% ] 40.26% | 56,696 | 42.9% |
[ 40.0% - 40.5% ] 40.48% | 42 | 22.2% |
[ 43.5% - 44.0% ] 43.73% | 1,873 | 50.4% |
[ 47.5% - 48.0% ] 47.76% | 2,718 | 51.3% |
[ 53.5% - 54.0% ] 53.91% | 64,751 | 63.1% |
[ 54.0% - 54.5% ] 54.26% | 74,891 | 60.2% |
[ 59.0% - 59.5% ] 59.38% | 32 | 100.0% |