Immigrants from South America 1 or more Vehicles in Household
COMPARE
Immigrants from South America
Select to Compare
1 or more Vehicles in Household
Immigrants from South America 1 or more Vehicles in Household
88.8%
1+ VEHICLES AVAILABLE
7.0/ 100
METRIC RATING
223rd/ 347
METRIC RANK
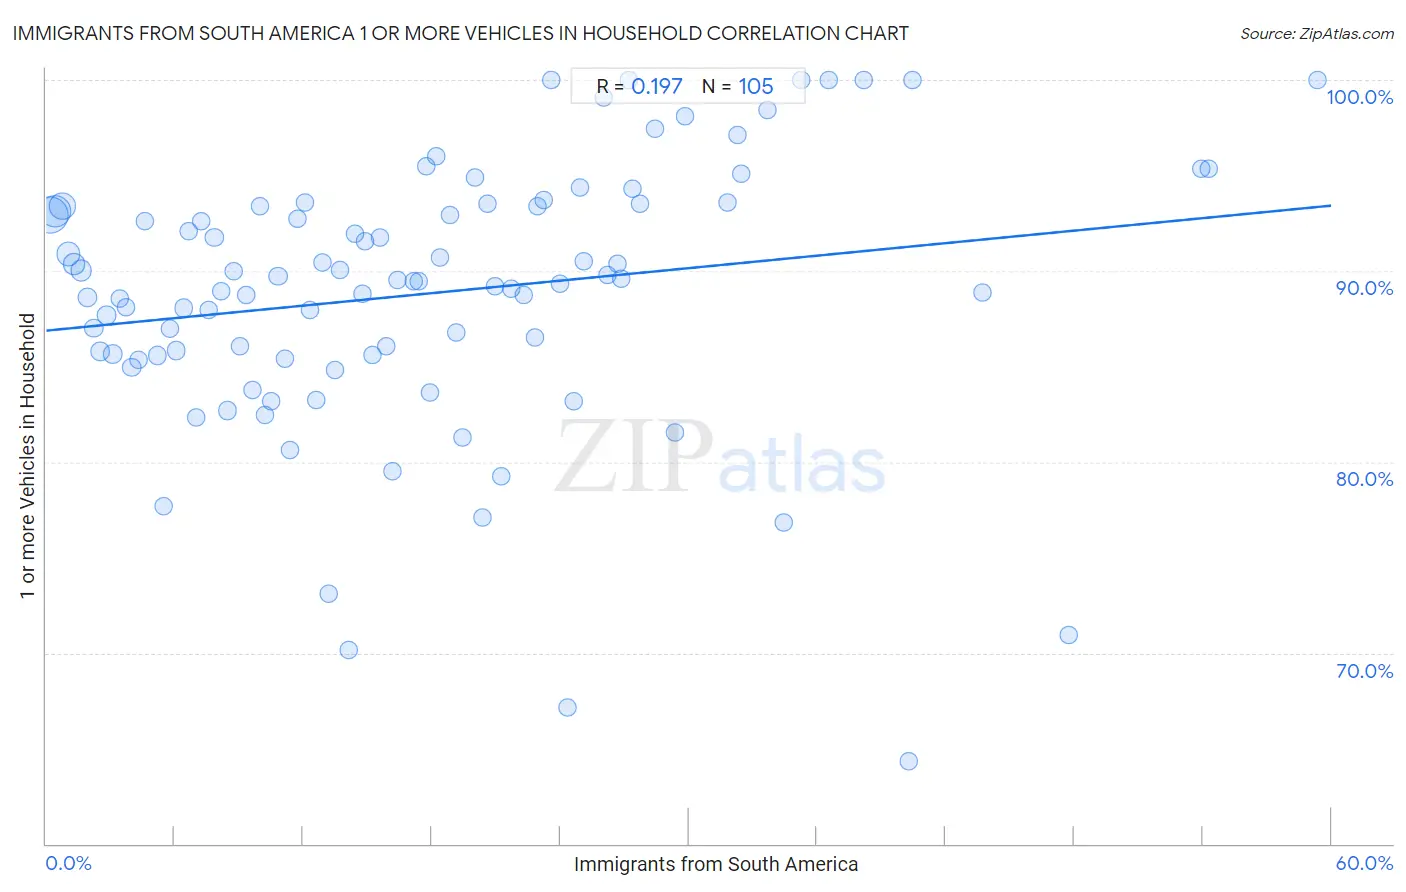
Immigrants from South America 1 or more Vehicles in Household Correlation Chart
The statistical analysis conducted on geographies consisting of 476,014,364 people shows a poor positive correlation between the proportion of Immigrants from South America and percentage of households with 1 or more vehicles available in the United States with a correlation coefficient (R) of 0.197 and weighted average of 88.8%. On average, for every 1% (one percent) increase in Immigrants from South America within a typical geography, there is an increase of 0.11% in percentage of households with 1 or more vehicles available.
It is essential to understand that the correlation between the percentage of Immigrants from South America and percentage of households with 1 or more vehicles available does not imply a direct cause-and-effect relationship. It remains uncertain whether the presence of Immigrants from South America influences an upward or downward trend in the level of percentage of households with 1 or more vehicles available within an area, or if Immigrants from South America simply ended up residing in those areas with higher or lower levels of percentage of households with 1 or more vehicles available due to other factors.
Demographics Similar to Immigrants from South America by 1 or more Vehicles in Household
In terms of 1 or more vehicles in household, the demographic groups most similar to Immigrants from South America are Uruguayan (88.8%, a difference of 0.0%), Peruvian (88.8%, a difference of 0.050%), Immigrants from Hong Kong (88.7%, a difference of 0.050%), Cree (88.7%, a difference of 0.060%), and Immigrants from Zaire (88.8%, a difference of 0.070%).
| Demographics | Rating | Rank | 1 or more Vehicles in Household |
| Immigrants from Argentina | 9.4 /100 | #216 | Tragic 88.9% |
| Argentineans | 8.8 /100 | #217 | Tragic 88.9% |
| Ugandans | 8.7 /100 | #218 | Tragic 88.9% |
| Immigrants from Guatemala | 8.6 /100 | #219 | Tragic 88.9% |
| Immigrants from Zaire | 8.1 /100 | #220 | Tragic 88.8% |
| Peruvians | 7.9 /100 | #221 | Tragic 88.8% |
| Uruguayans | 7.0 /100 | #222 | Tragic 88.8% |
| Immigrants from South America | 7.0 /100 | #223 | Tragic 88.8% |
| Immigrants from Hong Kong | 6.2 /100 | #224 | Tragic 88.7% |
| Cree | 6.0 /100 | #225 | Tragic 88.7% |
| Cheyenne | 5.7 /100 | #226 | Tragic 88.7% |
| Ute | 5.6 /100 | #227 | Tragic 88.7% |
| Immigrants from Norway | 5.5 /100 | #228 | Tragic 88.7% |
| Immigrants from Romania | 5.4 /100 | #229 | Tragic 88.7% |
| Immigrants from Sierra Leone | 5.2 /100 | #230 | Tragic 88.7% |
Immigrants from South America 1 or more Vehicles in Household Correlation Summary
| Measurement | Immigrants from South America Data | 1 or more Vehicles in Household Data |
| Minimum | 0.15% | 64.3% |
| Maximum | 59.4% | 100.0% |
| Range | 59.2% | 35.7% |
| Mean | 17.9% | 88.8% |
| Median | 15.9% | 89.5% |
| Interquartile 25% (IQ1) | 8.0% | 85.6% |
| Interquartile 75% (IQ3) | 25.0% | 93.4% |
| Interquartile Range (IQR) | 17.0% | 7.8% |
| Standard Deviation (Sample) | 12.7% | 7.0% |
| Standard Deviation (Population) | 12.6% | 7.0% |
Correlation Details
| Immigrants from South America Percentile | Sample Size | 1 or more Vehicles in Household |
[ 0.0% - 0.5% ] 0.15% | 141,768,701 | 92.9% |
[ 0.0% - 0.5% ] 0.43% | 103,602,686 | 93.1% |
[ 0.5% - 1.0% ] 0.74% | 68,022,404 | 93.4% |
[ 1.0% - 1.5% ] 1.04% | 43,641,081 | 90.9% |
[ 1.0% - 1.5% ] 1.31% | 23,862,141 | 90.4% |
[ 1.5% - 2.0% ] 1.63% | 20,452,666 | 90.0% |
[ 1.5% - 2.0% ] 1.93% | 10,552,472 | 88.6% |
[ 2.0% - 2.5% ] 2.23% | 8,858,086 | 87.0% |
[ 2.5% - 3.0% ] 2.51% | 7,357,727 | 85.8% |
[ 2.5% - 3.0% ] 2.81% | 4,512,354 | 87.7% |
[ 3.0% - 3.5% ] 3.11% | 5,322,038 | 85.6% |
[ 3.0% - 3.5% ] 3.42% | 3,440,272 | 88.5% |
[ 3.5% - 4.0% ] 3.72% | 3,792,384 | 88.1% |
[ 3.5% - 4.0% ] 4.00% | 2,625,863 | 84.9% |
[ 4.0% - 4.5% ] 4.32% | 2,540,073 | 85.4% |
[ 4.5% - 5.0% ] 4.61% | 1,966,866 | 92.6% |
[ 5.0% - 5.5% ] 5.19% | 2,142,418 | 85.6% |
[ 5.0% - 5.5% ] 5.49% | 1,373,846 | 77.7% |
[ 5.5% - 6.0% ] 5.77% | 1,262,152 | 87.0% |
[ 6.0% - 6.5% ] 6.08% | 961,443 | 85.8% |
[ 6.0% - 6.5% ] 6.40% | 620,941 | 88.1% |
[ 6.5% - 7.0% ] 6.65% | 1,087,543 | 92.1% |
[ 6.5% - 7.0% ] 6.98% | 799,948 | 82.3% |
[ 7.0% - 7.5% ] 7.24% | 649,716 | 92.6% |
[ 7.5% - 8.0% ] 7.56% | 751,556 | 88.0% |
[ 7.5% - 8.0% ] 7.85% | 491,964 | 91.8% |
[ 8.0% - 8.5% ] 8.16% | 708,537 | 89.0% |
[ 8.0% - 8.5% ] 8.45% | 686,486 | 82.7% |
[ 8.5% - 9.0% ] 8.75% | 618,925 | 90.0% |
[ 9.0% - 9.5% ] 9.02% | 477,033 | 86.1% |
[ 9.0% - 9.5% ] 9.36% | 701,531 | 88.8% |
[ 9.5% - 10.0% ] 9.64% | 309,679 | 83.8% |
[ 9.5% - 10.0% ] 9.95% | 576,680 | 93.4% |
[ 10.0% - 10.5% ] 10.24% | 460,392 | 82.5% |
[ 10.5% - 11.0% ] 10.53% | 629,631 | 83.2% |
[ 10.5% - 11.0% ] 10.83% | 609,778 | 89.7% |
[ 11.0% - 11.5% ] 11.13% | 762,305 | 85.4% |
[ 11.0% - 11.5% ] 11.38% | 269,406 | 80.6% |
[ 11.5% - 12.0% ] 11.73% | 185,575 | 92.8% |
[ 12.0% - 12.5% ] 12.07% | 133,032 | 93.6% |
[ 12.0% - 12.5% ] 12.33% | 352,769 | 88.0% |
[ 12.5% - 13.0% ] 12.60% | 75,163 | 83.2% |
[ 12.5% - 13.0% ] 12.88% | 622,188 | 90.4% |
[ 13.0% - 13.5% ] 13.17% | 596,054 | 73.1% |
[ 13.0% - 13.5% ] 13.50% | 406,867 | 84.8% |
[ 13.5% - 14.0% ] 13.74% | 97,814 | 90.1% |
[ 14.0% - 14.5% ] 14.15% | 20,322 | 70.2% |
[ 14.0% - 14.5% ] 14.43% | 178,189 | 91.9% |
[ 14.5% - 15.0% ] 14.74% | 365,719 | 88.8% |
[ 14.5% - 15.0% ] 14.90% | 200,678 | 91.5% |
[ 15.0% - 15.5% ] 15.21% | 58,536 | 85.6% |
[ 15.5% - 16.0% ] 15.59% | 161,299 | 91.8% |
[ 15.5% - 16.0% ] 15.90% | 167,210 | 86.0% |
[ 16.0% - 16.5% ] 16.15% | 398,137 | 79.5% |
[ 16.0% - 16.5% ] 16.39% | 197,932 | 89.5% |
[ 17.0% - 17.5% ] 17.15% | 173,635 | 89.5% |
[ 17.0% - 17.5% ] 17.39% | 143,461 | 89.4% |
[ 17.5% - 18.0% ] 17.72% | 34,922 | 95.5% |
[ 17.5% - 18.0% ] 17.93% | 116,676 | 83.6% |
[ 18.0% - 18.5% ] 18.22% | 13,503 | 96.0% |
[ 18.0% - 18.5% ] 18.41% | 79,484 | 90.7% |
[ 18.5% - 19.0% ] 18.84% | 141,348 | 93.0% |
[ 19.0% - 19.5% ] 19.16% | 199,419 | 86.8% |
[ 19.0% - 19.5% ] 19.42% | 288,444 | 81.3% |
[ 19.5% - 20.0% ] 19.99% | 65,589 | 94.9% |
[ 20.0% - 20.5% ] 20.36% | 33,160 | 77.1% |
[ 20.5% - 21.0% ] 20.62% | 93,099 | 93.5% |
[ 20.5% - 21.0% ] 20.93% | 117,896 | 89.2% |
[ 21.0% - 21.5% ] 21.26% | 69,714 | 79.2% |
[ 21.5% - 22.0% ] 21.72% | 2,408 | 89.0% |
[ 22.0% - 22.5% ] 22.30% | 3,435 | 88.8% |
[ 22.5% - 23.0% ] 22.80% | 89,531 | 86.5% |
[ 22.5% - 23.0% ] 22.94% | 9,176 | 93.4% |
[ 23.0% - 23.5% ] 23.23% | 57,066 | 93.7% |
[ 23.5% - 24.0% ] 23.56% | 191 | 100.0% |
[ 24.0% - 24.5% ] 24.01% | 17,136 | 89.3% |
[ 24.0% - 24.5% ] 24.32% | 22,204 | 67.2% |
[ 24.5% - 25.0% ] 24.63% | 35,967 | 83.2% |
[ 24.5% - 25.0% ] 24.91% | 15,184 | 94.4% |
[ 25.0% - 25.5% ] 25.12% | 45,457 | 90.5% |
[ 26.0% - 26.5% ] 26.05% | 11,809 | 99.1% |
[ 26.0% - 26.5% ] 26.23% | 42,058 | 89.8% |
[ 26.5% - 27.0% ] 26.68% | 40,106 | 90.4% |
[ 26.5% - 27.0% ] 26.82% | 44,742 | 89.6% |
[ 27.0% - 27.5% ] 27.19% | 217 | 100.0% |
[ 27.0% - 27.5% ] 27.39% | 16,450 | 94.3% |
[ 27.5% - 28.0% ] 27.70% | 39,225 | 93.5% |
[ 28.0% - 28.5% ] 28.45% | 703 | 97.4% |
[ 29.0% - 29.5% ] 29.39% | 51,153 | 81.5% |
[ 29.5% - 30.0% ] 29.82% | 23,734 | 98.1% |
[ 31.5% - 32.0% ] 31.82% | 5,843 | 93.6% |
[ 32.0% - 32.5% ] 32.25% | 17,450 | 97.2% |
[ 32.0% - 32.5% ] 32.43% | 16,333 | 95.1% |
[ 33.5% - 34.0% ] 33.70% | 99,543 | 98.5% |
[ 34.0% - 34.5% ] 34.45% | 48,096 | 76.8% |
[ 35.0% - 35.5% ] 35.23% | 88 | 100.0% |
[ 36.5% - 37.0% ] 36.55% | 249 | 100.0% |
[ 38.0% - 38.5% ] 38.15% | 249 | 100.0% |
[ 40.0% - 40.5% ] 40.26% | 56,696 | 64.3% |
[ 40.0% - 40.5% ] 40.48% | 42 | 100.0% |
[ 43.5% - 44.0% ] 43.73% | 1,873 | 88.8% |
[ 47.5% - 48.0% ] 47.76% | 2,718 | 70.9% |
[ 53.5% - 54.0% ] 53.91% | 64,751 | 95.3% |
[ 54.0% - 54.5% ] 54.26% | 74,891 | 95.4% |
[ 59.0% - 59.5% ] 59.38% | 32 | 100.0% |