Immigrants from South America 4 or more Vehicles in Household
COMPARE
Immigrants from South America
Select to Compare
4 or more Vehicles in Household
Immigrants from South America 4 or more Vehicles in Household
5.2%
4+ VEHICLES AVAILABLE
0.1/ 100
METRIC RATING
298th/ 347
METRIC RANK
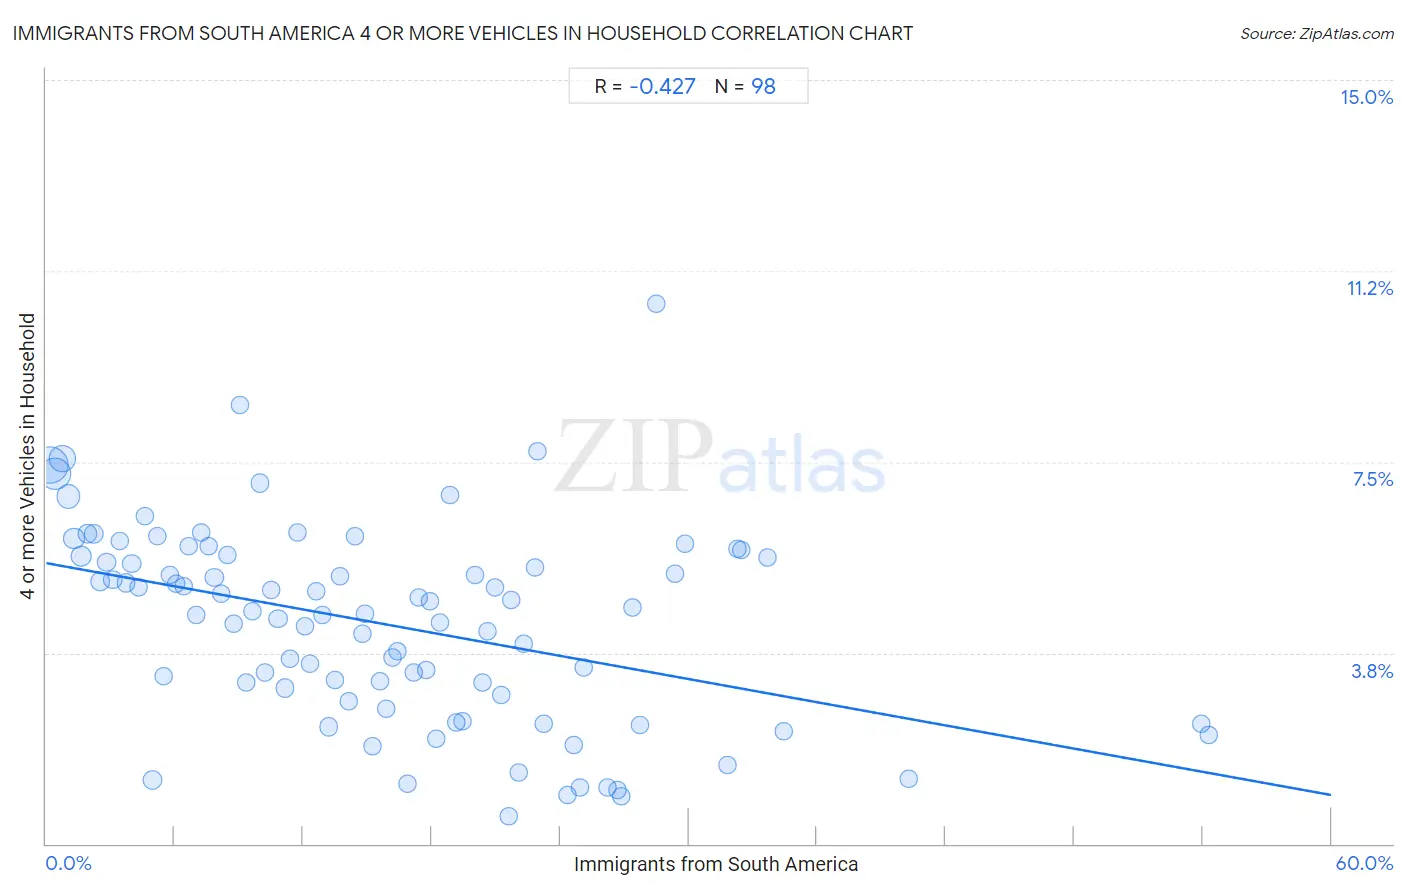
Immigrants from South America 4 or more Vehicles in Household Correlation Chart
The statistical analysis conducted on geographies consisting of 483,870,407 people shows a moderate negative correlation between the proportion of Immigrants from South America and percentage of households with 4 or more vehicles available in the United States with a correlation coefficient (R) of -0.427 and weighted average of 5.2%. On average, for every 1% (one percent) increase in Immigrants from South America within a typical geography, there is a decrease of 0.076% in percentage of households with 4 or more vehicles available.
It is essential to understand that the correlation between the percentage of Immigrants from South America and percentage of households with 4 or more vehicles available does not imply a direct cause-and-effect relationship. It remains uncertain whether the presence of Immigrants from South America influences an upward or downward trend in the level of percentage of households with 4 or more vehicles available within an area, or if Immigrants from South America simply ended up residing in those areas with higher or lower levels of percentage of households with 4 or more vehicles available due to other factors.
Demographics Similar to Immigrants from South America by 4 or more Vehicles in Household
In terms of 4 or more vehicles in household, the demographic groups most similar to Immigrants from South America are Immigrants from Venezuela (5.2%, a difference of 0.34%), Immigrants from Ghana (5.2%, a difference of 0.46%), Israeli (5.2%, a difference of 0.63%), Immigrants from Brazil (5.2%, a difference of 0.81%), and Ghanaian (5.2%, a difference of 0.92%).
| Demographics | Rating | Rank | 4 or more Vehicles in Household |
| Immigrants from Bahamas | 0.1 /100 | #291 | Tragic 5.3% |
| Liberians | 0.1 /100 | #292 | Tragic 5.3% |
| Immigrants from Congo | 0.1 /100 | #293 | Tragic 5.2% |
| Ghanaians | 0.1 /100 | #294 | Tragic 5.2% |
| Immigrants from Brazil | 0.1 /100 | #295 | Tragic 5.2% |
| Israelis | 0.1 /100 | #296 | Tragic 5.2% |
| Immigrants from Venezuela | 0.1 /100 | #297 | Tragic 5.2% |
| Immigrants from South America | 0.1 /100 | #298 | Tragic 5.2% |
| Immigrants from Ghana | 0.1 /100 | #299 | Tragic 5.2% |
| Immigrants from Morocco | 0.0 /100 | #300 | Tragic 5.1% |
| Immigrants from Zaire | 0.0 /100 | #301 | Tragic 5.1% |
| Bahamians | 0.0 /100 | #302 | Tragic 5.1% |
| Immigrants from Greece | 0.0 /100 | #303 | Tragic 5.1% |
| Cypriots | 0.0 /100 | #304 | Tragic 5.0% |
| Somalis | 0.0 /100 | #305 | Tragic 5.0% |
Immigrants from South America 4 or more Vehicles in Household Correlation Summary
| Measurement | Immigrants from South America Data | 4 or more Vehicles in Household Data |
| Minimum | 0.15% | 0.55% |
| Maximum | 54.3% | 10.6% |
| Range | 54.1% | 10.1% |
| Mean | 15.7% | 4.3% |
| Median | 14.6% | 4.5% |
| Interquartile 25% (IQ1) | 7.2% | 2.9% |
| Interquartile 75% (IQ3) | 22.0% | 5.6% |
| Interquartile Range (IQR) | 14.8% | 2.7% |
| Standard Deviation (Sample) | 10.8% | 1.9% |
| Standard Deviation (Population) | 10.8% | 1.9% |
Correlation Details
| Immigrants from South America Percentile | Sample Size | 4 or more Vehicles in Household |
[ 0.0% - 0.5% ] 0.15% | 141,578,098 | 7.4% |
[ 0.0% - 0.5% ] 0.43% | 103,478,072 | 7.3% |
[ 0.5% - 1.0% ] 0.74% | 67,860,974 | 7.6% |
[ 1.0% - 1.5% ] 1.04% | 43,531,897 | 6.8% |
[ 1.0% - 1.5% ] 1.31% | 23,701,237 | 6.0% |
[ 1.5% - 2.0% ] 1.63% | 20,258,475 | 5.6% |
[ 1.5% - 2.0% ] 1.93% | 10,396,376 | 6.1% |
[ 2.0% - 2.5% ] 2.23% | 8,639,043 | 6.1% |
[ 2.5% - 3.0% ] 2.51% | 7,144,138 | 5.2% |
[ 2.5% - 3.0% ] 2.81% | 4,399,871 | 5.5% |
[ 3.0% - 3.5% ] 3.11% | 5,282,392 | 5.2% |
[ 3.0% - 3.5% ] 3.42% | 3,326,910 | 5.9% |
[ 3.5% - 4.0% ] 3.71% | 3,756,993 | 5.1% |
[ 3.5% - 4.0% ] 4.00% | 2,608,526 | 5.5% |
[ 4.0% - 4.5% ] 4.32% | 2,539,742 | 5.0% |
[ 4.5% - 5.0% ] 4.61% | 1,956,035 | 6.4% |
[ 4.5% - 5.0% ] 4.98% | 9,728,168 | 1.2% |
[ 5.0% - 5.5% ] 5.20% | 2,082,071 | 6.0% |
[ 5.0% - 5.5% ] 5.48% | 1,274,981 | 3.3% |
[ 5.5% - 6.0% ] 5.77% | 1,259,601 | 5.3% |
[ 6.0% - 6.5% ] 6.08% | 960,737 | 5.1% |
[ 6.0% - 6.5% ] 6.40% | 585,527 | 5.1% |
[ 6.5% - 7.0% ] 6.65% | 1,085,465 | 5.9% |
[ 6.5% - 7.0% ] 6.98% | 798,864 | 4.5% |
[ 7.0% - 7.5% ] 7.24% | 647,038 | 6.1% |
[ 7.5% - 8.0% ] 7.56% | 750,876 | 5.8% |
[ 7.5% - 8.0% ] 7.85% | 490,870 | 5.2% |
[ 8.0% - 8.5% ] 8.16% | 702,271 | 4.9% |
[ 8.0% - 8.5% ] 8.44% | 638,007 | 5.7% |
[ 8.5% - 9.0% ] 8.75% | 618,925 | 4.3% |
[ 9.0% - 9.5% ] 9.02% | 475,937 | 8.6% |
[ 9.0% - 9.5% ] 9.36% | 701,531 | 3.2% |
[ 9.5% - 10.0% ] 9.64% | 308,525 | 4.6% |
[ 9.5% - 10.0% ] 9.95% | 576,578 | 7.1% |
[ 10.0% - 10.5% ] 10.24% | 460,392 | 3.4% |
[ 10.5% - 11.0% ] 10.53% | 601,836 | 5.0% |
[ 10.5% - 11.0% ] 10.83% | 608,968 | 4.4% |
[ 11.0% - 11.5% ] 11.13% | 762,305 | 3.1% |
[ 11.0% - 11.5% ] 11.38% | 269,406 | 3.6% |
[ 11.5% - 12.0% ] 11.73% | 185,516 | 6.1% |
[ 12.0% - 12.5% ] 12.07% | 130,897 | 4.3% |
[ 12.0% - 12.5% ] 12.33% | 352,655 | 3.5% |
[ 12.5% - 13.0% ] 12.60% | 75,163 | 5.0% |
[ 12.5% - 13.0% ] 12.88% | 621,109 | 4.5% |
[ 13.0% - 13.5% ] 13.17% | 595,767 | 2.3% |
[ 13.0% - 13.5% ] 13.50% | 406,867 | 3.2% |
[ 13.5% - 14.0% ] 13.74% | 97,756 | 5.2% |
[ 14.0% - 14.5% ] 14.15% | 20,322 | 2.8% |
[ 14.0% - 14.5% ] 14.43% | 178,189 | 6.0% |
[ 14.5% - 15.0% ] 14.74% | 365,630 | 4.1% |
[ 14.5% - 15.0% ] 14.90% | 200,678 | 4.5% |
[ 15.0% - 15.5% ] 15.21% | 53,689 | 1.9% |
[ 15.5% - 16.0% ] 15.59% | 161,299 | 3.2% |
[ 15.5% - 16.0% ] 15.90% | 167,210 | 2.7% |
[ 16.0% - 16.5% ] 16.15% | 397,983 | 3.7% |
[ 16.0% - 16.5% ] 16.39% | 197,932 | 3.8% |
[ 16.5% - 17.0% ] 16.85% | 128,146 | 1.2% |
[ 17.0% - 17.5% ] 17.15% | 173,635 | 3.4% |
[ 17.0% - 17.5% ] 17.39% | 143,078 | 4.8% |
[ 17.5% - 18.0% ] 17.72% | 34,922 | 3.4% |
[ 17.5% - 18.0% ] 17.93% | 116,676 | 4.8% |
[ 18.0% - 18.5% ] 18.22% | 13,503 | 2.1% |
[ 18.0% - 18.5% ] 18.41% | 79,484 | 4.3% |
[ 18.5% - 19.0% ] 18.84% | 141,348 | 6.8% |
[ 19.0% - 19.5% ] 19.16% | 199,419 | 2.4% |
[ 19.0% - 19.5% ] 19.42% | 288,403 | 2.4% |
[ 19.5% - 20.0% ] 19.99% | 65,589 | 5.3% |
[ 20.0% - 20.5% ] 20.36% | 33,160 | 3.2% |
[ 20.5% - 21.0% ] 20.62% | 93,099 | 4.2% |
[ 20.5% - 21.0% ] 20.93% | 117,896 | 5.0% |
[ 21.0% - 21.5% ] 21.26% | 69,714 | 2.9% |
[ 21.5% - 22.0% ] 21.59% | 117,157 | 0.55% |
[ 21.5% - 22.0% ] 21.72% | 2,367 | 4.8% |
[ 22.0% - 22.5% ] 22.04% | 99,633 | 1.4% |
[ 22.0% - 22.5% ] 22.30% | 3,435 | 3.9% |
[ 22.5% - 23.0% ] 22.80% | 89,531 | 5.4% |
[ 22.5% - 23.0% ] 22.94% | 9,176 | 7.7% |
[ 23.0% - 23.5% ] 23.23% | 57,066 | 2.4% |
[ 24.0% - 24.5% ] 24.32% | 22,121 | 0.96% |
[ 24.5% - 25.0% ] 24.63% | 35,967 | 1.9% |
[ 24.5% - 25.0% ] 24.91% | 15,184 | 1.1% |
[ 25.0% - 25.5% ] 25.12% | 45,457 | 3.5% |
[ 26.0% - 26.5% ] 26.23% | 42,058 | 1.1% |
[ 26.5% - 27.0% ] 26.68% | 40,106 | 1.1% |
[ 26.5% - 27.0% ] 26.86% | 22,202 | 0.94% |
[ 27.0% - 27.5% ] 27.39% | 16,450 | 4.6% |
[ 27.5% - 28.0% ] 27.70% | 39,067 | 2.3% |
[ 28.0% - 28.5% ] 28.47% | 548 | 10.6% |
[ 29.0% - 29.5% ] 29.39% | 51,153 | 5.3% |
[ 29.5% - 30.0% ] 29.82% | 23,734 | 5.9% |
[ 31.5% - 32.0% ] 31.82% | 5,843 | 1.5% |
[ 32.0% - 32.5% ] 32.25% | 17,450 | 5.8% |
[ 32.0% - 32.5% ] 32.43% | 16,333 | 5.8% |
[ 33.5% - 34.0% ] 33.70% | 99,543 | 5.6% |
[ 34.0% - 34.5% ] 34.45% | 48,096 | 2.2% |
[ 40.0% - 40.5% ] 40.26% | 56,696 | 1.3% |
[ 53.5% - 54.0% ] 53.91% | 64,751 | 2.4% |
[ 54.0% - 54.5% ] 54.26% | 74,891 | 2.1% |