Immigrants from South America Wage/Income Gap
COMPARE
Immigrants from South America
Select to Compare
Wage/Income Gap
Immigrants from South America Wage/Income Gap
24.6%
WAGE/INCOME GAP
93.9/ 100
METRIC RATING
124th/ 347
METRIC RANK
Immigrants from South America Wage/Income Gap Correlation Chart
The statistical analysis conducted on geographies consisting of 485,807,349 people shows a moderate positive correlation between the proportion of Immigrants from South America and wage/income gap percentage in the United States with a correlation coefficient (R) of 0.454 and weighted average of 24.6%. On average, for every 1% (one percent) increase in Immigrants from South America within a typical geography, there is an increase of 0.40% in wage/income gap percentage.
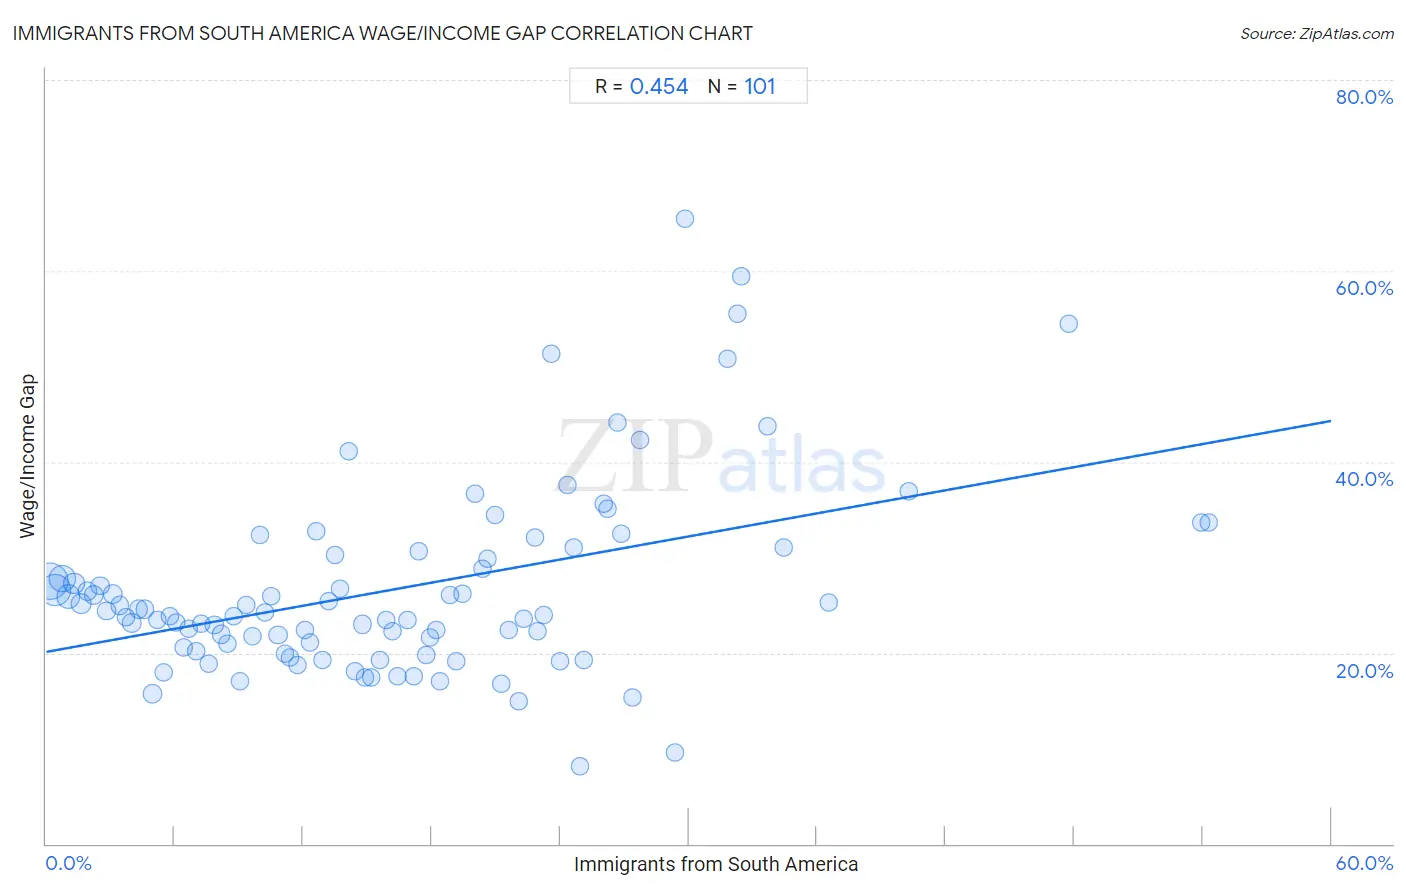
It is essential to understand that the correlation between the percentage of Immigrants from South America and wage/income gap percentage does not imply a direct cause-and-effect relationship. It remains uncertain whether the presence of Immigrants from South America influences an upward or downward trend in the level of wage/income gap percentage within an area, or if Immigrants from South America simply ended up residing in those areas with higher or lower levels of wage/income gap percentage due to other factors.
Demographics Similar to Immigrants from South America by Wage/Income Gap
In terms of wage/income gap, the demographic groups most similar to Immigrants from South America are Spanish American (24.6%, a difference of 0.020%), Immigrants from Uruguay (24.6%, a difference of 0.040%), German Russian (24.6%, a difference of 0.050%), Immigrants from Central America (24.6%, a difference of 0.11%), and Yup'ik (24.7%, a difference of 0.17%).
| Demographics | Rating | Rank | Wage/Income Gap |
| Immigrants from Afghanistan | 95.9 /100 | #117 | Exceptional 24.4% |
| Immigrants from Micronesia | 95.8 /100 | #118 | Exceptional 24.4% |
| Kenyans | 95.8 /100 | #119 | Exceptional 24.5% |
| Cree | 95.6 /100 | #120 | Exceptional 24.5% |
| Immigrants from Thailand | 94.9 /100 | #121 | Exceptional 24.5% |
| Apache | 94.8 /100 | #122 | Exceptional 24.5% |
| Natives/Alaskans | 94.6 /100 | #123 | Exceptional 24.6% |
| Immigrants from South America | 93.9 /100 | #124 | Exceptional 24.6% |
| Spanish Americans | 93.8 /100 | #125 | Exceptional 24.6% |
| Immigrants from Uruguay | 93.8 /100 | #126 | Exceptional 24.6% |
| German Russians | 93.7 /100 | #127 | Exceptional 24.6% |
| Immigrants from Central America | 93.5 /100 | #128 | Exceptional 24.6% |
| Yup'ik | 93.3 /100 | #129 | Exceptional 24.7% |
| Alsatians | 93.2 /100 | #130 | Exceptional 24.7% |
| Immigrants from Philippines | 93.0 /100 | #131 | Exceptional 24.7% |
Immigrants from South America Wage/Income Gap Correlation Summary
| Measurement | Immigrants from South America Data | Wage/Income Gap Data |
| Minimum | 0.15% | 8.2% |
| Maximum | 54.3% | 65.5% |
| Range | 54.1% | 57.3% |
| Mean | 16.3% | 26.7% |
| Median | 14.9% | 24.0% |
| Interquartile 25% (IQ1) | 7.4% | 20.4% |
| Interquartile 75% (IQ3) | 23.1% | 30.4% |
| Interquartile Range (IQR) | 15.7% | 10.0% |
| Standard Deviation (Sample) | 11.3% | 10.1% |
| Standard Deviation (Population) | 11.3% | 10.0% |
Correlation Details
| Immigrants from South America Percentile | Sample Size | Wage/Income Gap |
[ 0.0% - 0.5% ] 0.15% | 141,802,340 | 27.5% |
[ 0.0% - 0.5% ] 0.43% | 103,588,572 | 26.6% |
[ 0.5% - 1.0% ] 0.74% | 67,975,400 | 27.8% |
[ 1.0% - 1.5% ] 1.04% | 43,628,009 | 25.9% |
[ 1.0% - 1.5% ] 1.31% | 23,839,358 | 27.3% |
[ 1.5% - 2.0% ] 1.63% | 20,433,728 | 25.1% |
[ 1.5% - 2.0% ] 1.93% | 10,528,852 | 26.5% |
[ 2.0% - 2.5% ] 2.23% | 8,812,281 | 26.1% |
[ 2.5% - 3.0% ] 2.51% | 7,334,976 | 27.0% |
[ 2.5% - 3.0% ] 2.81% | 4,501,507 | 24.4% |
[ 3.0% - 3.5% ] 3.11% | 5,300,774 | 26.1% |
[ 3.0% - 3.5% ] 3.42% | 3,432,634 | 25.0% |
[ 3.5% - 4.0% ] 3.72% | 3,785,460 | 23.7% |
[ 3.5% - 4.0% ] 4.00% | 2,618,490 | 23.1% |
[ 4.0% - 4.5% ] 4.32% | 2,535,188 | 24.6% |
[ 4.5% - 5.0% ] 4.61% | 1,961,262 | 24.6% |
[ 4.5% - 5.0% ] 4.98% | 9,730,371 | 15.7% |
[ 5.0% - 5.5% ] 5.19% | 2,140,509 | 23.4% |
[ 5.0% - 5.5% ] 5.49% | 1,372,914 | 18.0% |
[ 5.5% - 6.0% ] 5.77% | 1,257,808 | 23.8% |
[ 6.0% - 6.5% ] 6.08% | 959,675 | 23.2% |
[ 6.0% - 6.5% ] 6.40% | 612,389 | 20.6% |
[ 6.5% - 7.0% ] 6.65% | 1,085,891 | 22.5% |
[ 6.5% - 7.0% ] 6.98% | 798,794 | 20.2% |
[ 7.0% - 7.5% ] 7.24% | 649,716 | 23.1% |
[ 7.5% - 8.0% ] 7.56% | 748,766 | 18.8% |
[ 7.5% - 8.0% ] 7.85% | 491,551 | 22.9% |
[ 8.0% - 8.5% ] 8.16% | 708,537 | 21.9% |
[ 8.0% - 8.5% ] 8.45% | 686,109 | 21.0% |
[ 8.5% - 9.0% ] 8.75% | 618,925 | 23.8% |
[ 9.0% - 9.5% ] 9.02% | 475,937 | 17.0% |
[ 9.0% - 9.5% ] 9.36% | 699,283 | 25.1% |
[ 9.5% - 10.0% ] 9.64% | 309,679 | 21.7% |
[ 9.5% - 10.0% ] 9.95% | 576,578 | 32.3% |
[ 10.0% - 10.5% ] 10.24% | 460,392 | 24.2% |
[ 10.5% - 11.0% ] 10.53% | 628,790 | 26.0% |
[ 10.5% - 11.0% ] 10.83% | 609,062 | 21.9% |
[ 11.0% - 11.5% ] 11.13% | 762,251 | 19.9% |
[ 11.0% - 11.5% ] 11.38% | 269,406 | 19.5% |
[ 11.5% - 12.0% ] 11.73% | 182,481 | 18.8% |
[ 12.0% - 12.5% ] 12.07% | 132,773 | 22.3% |
[ 12.0% - 12.5% ] 12.33% | 352,655 | 21.1% |
[ 12.5% - 13.0% ] 12.60% | 75,163 | 32.7% |
[ 12.5% - 13.0% ] 12.88% | 621,039 | 19.3% |
[ 13.0% - 13.5% ] 13.17% | 595,425 | 25.4% |
[ 13.0% - 13.5% ] 13.50% | 406,770 | 30.2% |
[ 13.5% - 14.0% ] 13.74% | 97,519 | 26.7% |
[ 14.0% - 14.5% ] 14.15% | 20,258 | 41.2% |
[ 14.0% - 14.5% ] 14.43% | 178,189 | 18.1% |
[ 14.5% - 15.0% ] 14.74% | 365,630 | 23.0% |
[ 14.5% - 15.0% ] 14.90% | 200,678 | 17.4% |
[ 15.0% - 15.5% ] 15.20% | 57,592 | 17.5% |
[ 15.5% - 16.0% ] 15.59% | 161,299 | 19.2% |
[ 15.5% - 16.0% ] 15.90% | 167,210 | 23.4% |
[ 16.0% - 16.5% ] 16.15% | 397,983 | 22.3% |
[ 16.0% - 16.5% ] 16.39% | 197,799 | 17.6% |
[ 16.5% - 17.0% ] 16.85% | 128,146 | 23.4% |
[ 17.0% - 17.5% ] 17.15% | 173,635 | 17.6% |
[ 17.0% - 17.5% ] 17.39% | 143,078 | 30.6% |
[ 17.5% - 18.0% ] 17.72% | 34,922 | 19.8% |
[ 17.5% - 18.0% ] 17.93% | 116,676 | 21.6% |
[ 18.0% - 18.5% ] 18.22% | 13,503 | 22.3% |
[ 18.0% - 18.5% ] 18.41% | 79,484 | 17.0% |
[ 18.5% - 19.0% ] 18.84% | 141,348 | 26.1% |
[ 19.0% - 19.5% ] 19.16% | 199,419 | 19.1% |
[ 19.0% - 19.5% ] 19.42% | 288,403 | 26.2% |
[ 19.5% - 20.0% ] 19.99% | 65,589 | 36.6% |
[ 20.0% - 20.5% ] 20.36% | 33,160 | 28.8% |
[ 20.5% - 21.0% ] 20.62% | 92,945 | 29.9% |
[ 20.5% - 21.0% ] 20.93% | 117,896 | 34.4% |
[ 21.0% - 21.5% ] 21.26% | 69,714 | 16.7% |
[ 21.5% - 22.0% ] 21.59% | 117,157 | 22.4% |
[ 22.0% - 22.5% ] 22.04% | 99,813 | 14.9% |
[ 22.0% - 22.5% ] 22.28% | 2,419 | 23.6% |
[ 22.5% - 23.0% ] 22.80% | 89,531 | 32.0% |
[ 22.5% - 23.0% ] 22.94% | 9,176 | 22.3% |
[ 23.0% - 23.5% ] 23.23% | 57,066 | 24.0% |
[ 23.5% - 24.0% ] 23.56% | 191 | 51.4% |
[ 24.0% - 24.5% ] 24.01% | 17,136 | 19.1% |
[ 24.0% - 24.5% ] 24.32% | 22,018 | 37.5% |
[ 24.5% - 25.0% ] 24.63% | 35,967 | 31.1% |
[ 24.5% - 25.0% ] 24.91% | 15,184 | 8.2% |
[ 25.0% - 25.5% ] 25.12% | 45,457 | 19.3% |
[ 26.0% - 26.5% ] 26.05% | 11,809 | 35.6% |
[ 26.0% - 26.5% ] 26.23% | 42,058 | 35.1% |
[ 26.5% - 27.0% ] 26.68% | 40,106 | 44.2% |
[ 26.5% - 27.0% ] 26.82% | 44,742 | 32.4% |
[ 27.0% - 27.5% ] 27.39% | 16,450 | 15.3% |
[ 27.5% - 28.0% ] 27.70% | 39,067 | 42.3% |
[ 29.0% - 29.5% ] 29.39% | 51,153 | 9.5% |
[ 29.5% - 30.0% ] 29.82% | 23,734 | 65.5% |
[ 31.5% - 32.0% ] 31.82% | 5,843 | 50.8% |
[ 32.0% - 32.5% ] 32.25% | 17,450 | 55.5% |
[ 32.0% - 32.5% ] 32.43% | 16,333 | 59.5% |
[ 33.5% - 34.0% ] 33.70% | 99,543 | 43.7% |
[ 34.0% - 34.5% ] 34.45% | 48,096 | 31.1% |
[ 36.5% - 37.0% ] 36.55% | 249 | 25.3% |
[ 40.0% - 40.5% ] 40.26% | 56,696 | 36.9% |
[ 47.5% - 48.0% ] 47.76% | 2,718 | 54.5% |
[ 53.5% - 54.0% ] 53.91% | 64,751 | 33.6% |
[ 54.0% - 54.5% ] 54.26% | 74,891 | 33.6% |