Immigrants from Netherlands GED/Equivalency

COMPARE

Immigrants from Netherlands
Race
Ancestry
AfghanAfricanAlaska NativeAlaskan AthabascanAlbanianAleutAlsatianAmericanApacheArabArapahoArgentineanArmenianAssyrian/Chaldean/SyriacAustralianAustrianBahamianBangladeshiBarbadianBasqueBelgianBelizeanBermudanBhutaneseBlackfeetBolivianBrazilianBritishBritish West IndianBulgarianBurmeseCajunCambodianCanadianCape VerdeanCarpatho RusynCelticCentral AmericanCentral American IndianCherokeeCheyenneChickasawChileanChineseChippewaChoctawColombianColvilleComancheCosta RicanCreeCreekCroatianCrowCubanCypriotCzechCzechoslovakianDanishDelawareDominicanDutchDutch West IndianEastern EuropeanEcuadorianEgyptianEnglishEstonianEthiopianEuropeanFijianFilipinoFinnishFrenchFrench American IndianFrench CanadianGermanGerman RussianGhanaianGreekGuamanian/ChamorroGuatemalanGuyaneseHaitianHmongHonduranHopiHoumaHungarianIcelanderIndian (Asian)IndonesianInupiatIranianIraqiIrishIroquoisIsraeliItalianJamaicanJapaneseJordanianKenyanKiowaKoreanLaotianLatvianLebaneseLiberianLithuanianLumbeeLuxembourgerMacedonianMalaysianMalteseMarshalleseMenomineeMexicanMexican American IndianMongolianMoroccanNative HawaiianNavajoNepaleseNew ZealanderNicaraguanNigerianNorthern EuropeanNorwegianOkinawanOsageOttawaPaiutePakistaniPalestinianPanamanianParaguayanPennsylvania GermanPeruvianPimaPolishPortuguesePotawatomiPuebloPuerto RicanPuget Sound SalishRomanianRussianSalvadoranSamoanScandinavianScotch-IrishScottishSeminoleSenegaleseSerbianShoshoneSierra LeoneanSiouxSlavicSlovakSloveneSomaliSouth AfricanSouth AmericanSouth American IndianSoviet UnionSpaniardSpanishSpanish AmericanSpanish American IndianSri LankanSubsaharan AfricanSudaneseSwedishSwissSyrianTaiwaneseThaiTlingit-HaidaTohono O'OdhamTonganTrinidadian and TobagonianTsimshianTurkishU.S. Virgin IslanderUgandanUkrainianUruguayanUteVenezuelanVietnameseWelshWest IndianYakamaYaquiYugoslavianYumanYup'ikZimbabwean
Immigration
NonimmigrantsImmigrantsAfghanistanAfricaAlbaniaArgentinaArmeniaAsiaAustraliaAustriaBahamasBangladeshBarbadosBelarusBelgiumBelizeBoliviaBosnia and HerzegovinaBrazilBulgariaBurma/MyanmarCabo VerdeCambodiaCameroonCanadaCaribbeanCentral AmericaChileChinaColombiaCongoCosta RicaCroatiaCubaCzechoslovakiaDenmarkDominicaDominican RepublicEastern AfricaEastern AsiaEastern EuropeEcuadorEgyptEl SalvadorEnglandEritreaEthiopiaEuropeFijiFranceGermanyGhanaGreeceGrenadaGuatemalaGuyanaHaitiHondurasHong KongHungaryIndiaIndonesiaIranIraqIrelandIsraelItalyJamaicaJapanJordanKazakhstanKenyaKoreaKuwaitLaosLatin AmericaLatviaLebanonLiberiaLithuaniaMalaysiaMexicoMicronesiaMiddle AfricaMoldovaMoroccoNepalNetherlandsNicaraguaNigeriaNorth AmericaNorth MacedoniaNorthern AfricaNorthern EuropeNorwayOceaniaPakistanPanamaPeruPhilippinesPolandPortugalRomaniaRussiaSaudi ArabiaScotlandSenegalSerbiaSierra LeoneSingaporeSomaliaSouth AfricaSouth AmericaSouth Central AsiaSouth Eastern AsiaSouthern EuropeSpainSri LankaSt. Vincent and the GrenadinesSudanSwedenSwitzerlandSyriaTaiwanThailandTrinidad and TobagoTurkeyUgandaUkraineUruguayUzbekistanVenezuelaVietnamWest IndiesWestern AfricaWestern AsiaWestern EuropeYemenZaireZimbabweAzores
Select to Compare
Race
Ancestry
AfghanAfricanAlaska NativeAlaskan AthabascanAlbanianAleutAlsatianAmericanApacheArabArapahoArgentineanArmenianAssyrian/Chaldean/SyriacAustralianAustrianBahamianBangladeshiBarbadianBasqueBelgianBelizeanBermudanBhutaneseBlackfeetBolivianBrazilianBritishBritish West IndianBulgarianBurmeseCajunCambodianCanadianCape VerdeanCarpatho RusynCelticCentral AmericanCentral American IndianCherokeeCheyenneChickasawChileanChineseChippewaChoctawColombianColvilleComancheCosta RicanCreeCreekCroatianCrowCubanCypriotCzechCzechoslovakianDanishDelawareDominicanDutchDutch West IndianEastern EuropeanEcuadorianEgyptianEnglishEstonianEthiopianEuropeanFijianFilipinoFinnishFrenchFrench American IndianFrench CanadianGermanGerman RussianGhanaianGreekGuamanian/ChamorroGuatemalanGuyaneseHaitianHmongHonduranHopiHoumaHungarianIcelanderIndian (Asian)IndonesianInupiatIranianIraqiIrishIroquoisIsraeliItalianJamaicanJapaneseJordanianKenyanKiowaKoreanLaotianLatvianLebaneseLiberianLithuanianLumbeeLuxembourgerMacedonianMalaysianMalteseMarshalleseMenomineeMexicanMexican American IndianMongolianMoroccanNative HawaiianNavajoNepaleseNew ZealanderNicaraguanNigerianNorthern EuropeanNorwegianOkinawanOsageOttawaPaiutePakistaniPalestinianPanamanianParaguayanPennsylvania GermanPeruvianPimaPolishPortuguesePotawatomiPuebloPuerto RicanPuget Sound SalishRomanianRussianSalvadoranSamoanScandinavianScotch-IrishScottishSeminoleSenegaleseSerbianShoshoneSierra LeoneanSiouxSlavicSlovakSloveneSomaliSouth AfricanSouth AmericanSouth American IndianSoviet UnionSpaniardSpanishSpanish AmericanSpanish American IndianSri LankanSubsaharan AfricanSudaneseSwedishSwissSyrianTaiwaneseThaiTlingit-HaidaTohono O'OdhamTonganTrinidadian and TobagonianTsimshianTurkishU.S. Virgin IslanderUgandanUkrainianUruguayanUteVenezuelanVietnameseWelshWest IndianYakamaYaquiYugoslavianYumanYup'ikZimbabwean
Immigration
NonimmigrantsImmigrantsAfghanistanAfricaAlbaniaArgentinaArmeniaAsiaAustraliaAustriaBahamasBangladeshBarbadosBelarusBelgiumBelizeBoliviaBosnia and HerzegovinaBrazilBulgariaBurma/MyanmarCabo VerdeCambodiaCameroonCanadaCaribbeanCentral AmericaChileChinaColombiaCongoCosta RicaCroatiaCubaCzechoslovakiaDenmarkDominicaDominican RepublicEastern AfricaEastern AsiaEastern EuropeEcuadorEgyptEl SalvadorEnglandEritreaEthiopiaEuropeFijiFranceGermanyGhanaGreeceGrenadaGuatemalaGuyanaHaitiHondurasHong KongHungaryIndiaIndonesiaIranIraqIrelandIsraelItalyJamaicaJapanJordanKazakhstanKenyaKoreaKuwaitLaosLatin AmericaLatviaLebanonLiberiaLithuaniaMalaysiaMexicoMicronesiaMiddle AfricaMoldovaMoroccoNepalNicaraguaNigeriaNorth AmericaNorth MacedoniaNorthern AfricaNorthern EuropeNorwayOceaniaPakistanPanamaPeruPhilippinesPolandPortugalRomaniaRussiaSaudi ArabiaScotlandSenegalSerbiaSierra LeoneSingaporeSomaliaSouth AfricaSouth AmericaSouth Central AsiaSouth Eastern AsiaSouthern EuropeSpainSri LankaSt. Vincent and the GrenadinesSudanSwedenSwitzerlandSyriaTaiwanThailandTrinidad and TobagoTurkeyUgandaUkraineUruguayUzbekistanVenezuelaVietnamWest IndiesWestern AfricaWestern AsiaWestern EuropeYemenZaireZimbabweAzores
GED/Equivalency
Income
Poverty
Unemployment
Labor Participation
Family Structure
Vehicle Availability
Education Level
Disability

Immigrants from Netherlands GED/Equivalency
Exceptional

88.0%
GED/EQUIVALENCY
99.4/ 100
METRIC RATING
51st/ 347
METRIC RANK

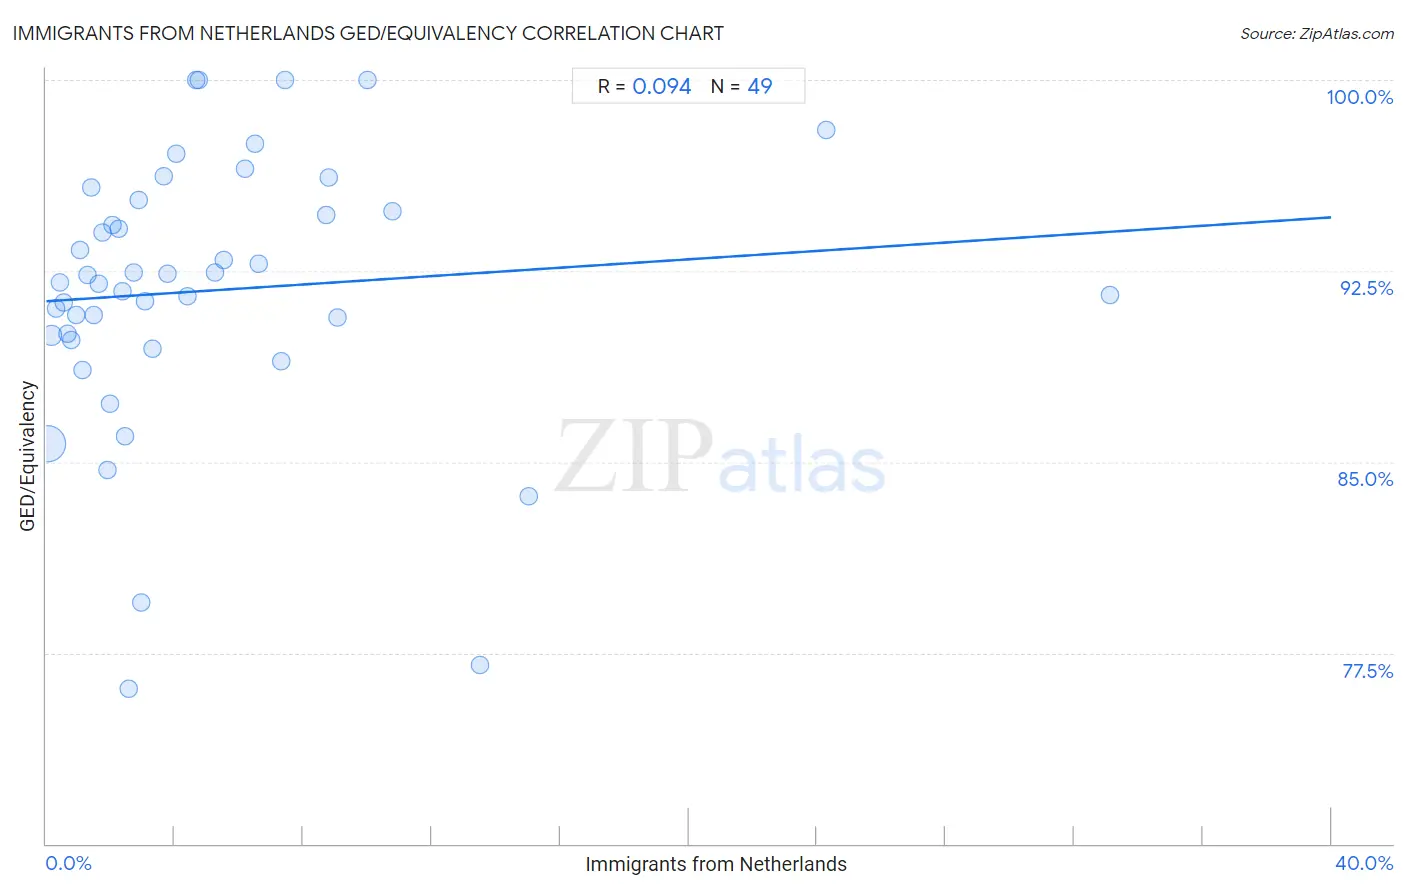
Immigrants from Netherlands GED/Equivalency Correlation Chart

The statistical analysis conducted on geographies consisting of 237,874,463 people shows a slight positive correlation between the proportion of Immigrants from Netherlands and percentage of population with at least ged/equivalency education in the United States with a correlation coefficient (R) of 0.094 and weighted average of 88.0%. On average, for every 1% (one percent) increase in Immigrants from Netherlands within a typical geography, there is an increase of 0.082% in percentage of population with at least ged/equivalency education.
Immigrants from Netherlands GED/Equivalency
It is essential to understand that the correlation between the percentage of Immigrants from Netherlands and percentage of population with at least ged/equivalency education does not imply a direct cause-and-effect relationship. It remains uncertain whether the presence of Immigrants from Netherlands influences an upward or downward trend in the level of percentage of population with at least ged/equivalency education within an area, or if Immigrants from Netherlands simply ended up residing in those areas with higher or lower levels of percentage of population with at least ged/equivalency education due to other factors.

Demographics Similar to Immigrants from Netherlands by GED/Equivalency

In terms of ged/equivalency, the demographic groups most similar to Immigrants from Netherlands are Zimbabwean (88.0%, a difference of 0.0%), Immigrants from South Africa (88.0%, a difference of 0.0%), Soviet Union (88.0%, a difference of 0.010%), New Zealander (88.0%, a difference of 0.020%), and Immigrants from Denmark (88.0%, a difference of 0.030%).
DemographicsRating | RankGED/Equivalency
Macedonians
99.5
/100
|
#44
Exceptional
88.1%
Czechs
99.5
/100
|
#45
Exceptional
88.1%
Immigrants from Switzerland
99.5
/100
|
#46
Exceptional
88.1%
Immigrants from Latvia
99.5
/100
|
#47
Exceptional
88.1%
Greeks
99.5
/100
|
#48
Exceptional
88.1%
Australians
99.5
/100
|
#49
Exceptional
88.1%
Immigrants from Korea
99.5
/100
|
#50
Exceptional
88.1%
Immigrants from Netherlands
99.4
/100
|
#51
Exceptional
88.0%
Zimbabweans
99.4
/100
|
#52
Exceptional
88.0%
Immigrants from South Africa
99.4
/100
|
#53
Exceptional
88.0%
Soviet Union
99.4
/100
|
#54
Exceptional
88.0%
New Zealanders
99.4
/100
|
#55
Exceptional
88.0%
Immigrants from Denmark
99.4
/100
|
#56
Exceptional
88.0%
Immigrants from Czechoslovakia
99.3
/100
|
#57
Exceptional
87.9%
Northern Europeans
99.3
/100
|
#58
Exceptional
87.9%

Immigrants from Netherlands GED/Equivalency Correlation Summary

MeasurementImmigrants from Netherlands DataGED/Equivalency Data
Minimum0.037%76.1%
Maximum33.1%100.0%
Range33.1%23.9%
Mean5.1%91.7%
Median3.0%92.1%
Interquartile 25% (IQ1)1.4%89.9%
Interquartile 75% (IQ3)6.6%95.1%
Interquartile Range (IQR)5.1%5.2%
Standard Deviation (Sample)6.1%5.3%
Standard Deviation (Population)6.0%5.3%

Correlation Details

Immigrants from Netherlands PercentileSample SizeGED/Equivalency
[
0.0%
-
0.5%
]
0.037%
210,967,01385.7%
[
0.0%
-
0.5%
]
0.17%
18,908,55390.0%
[
0.0%
-
0.5%
]
0.29%
4,459,29091.0%
[
0.0%
-
0.5%
]
0.42%
1,585,95792.1%
[
0.5%
-
1.0%
]
0.54%
653,00791.2%
[
0.5%
-
1.0%
]
0.67%
371,91590.0%
[
0.5%
-
1.0%
]
0.79%
350,80489.8%
[
0.5%
-
1.0%
]
0.93%
99,89490.8%
[
1.0%
-
1.5%
]
1.05%
125,94593.3%
[
1.0%
-
1.5%
]
1.14%
73,64088.6%
[
1.0%
-
1.5%
]
1.29%
49,47992.3%
[
1.0%
-
1.5%
]
1.40%
56,68595.8%
[
1.0%
-
1.5%
]
1.49%
35,09390.7%
[
1.5%
-
2.0%
]
1.64%
15,95692.0%
[
1.5%
-
2.0%
]
1.74%
11,10194.0%
[
1.5%
-
2.0%
]
1.89%
6,02084.7%
[
1.5%
-
2.0%
]
2.00%
12,06487.3%
[
2.0%
-
2.5%
]
2.07%
25,11594.3%
[
2.0%
-
2.5%
]
2.24%
3,97694.1%
[
2.0%
-
2.5%
]
2.38%
15,14191.7%
[
2.0%
-
2.5%
]
2.45%
5,09786.0%
[
2.5%
-
3.0%
]
2.57%
7,47176.1%
[
2.5%
-
3.0%
]
2.72%
6,13392.4%
[
2.5%
-
3.0%
]
2.89%
2,52795.3%
[
2.5%
-
3.0%
]
2.97%
67379.5%
[
3.0%
-
3.5%
]
3.07%
5,36791.3%
[
3.0%
-
3.5%
]
3.30%
36489.4%
[
3.5%
-
4.0%
]
3.67%
40996.2%
[
3.5%
-
4.0%
]
3.78%
1,82692.4%
[
4.0%
-
4.5%
]
4.04%
4,16197.1%
[
4.0%
-
4.5%
]
4.39%
1,14091.5%
[
4.5%
-
5.0%
]
4.68%
2,778100.0%
[
4.5%
-
5.0%
]
4.76%
315100.0%
[
5.0%
-
5.5%
]
5.23%
1,77792.4%
[
5.5%
-
6.0%
]
5.53%
77892.9%
[
6.0%
-
6.5%
]
6.18%
1,35996.5%
[
6.5%
-
7.0%
]
6.50%
44697.5%
[
6.5%
-
7.0%
]
6.60%
80392.8%
[
7.0%
-
7.5%
]
7.30%
17889.0%
[
7.0%
-
7.5%
]
7.43%
996100.0%
[
8.5%
-
9.0%
]
8.72%
96394.7%
[
8.5%
-
9.0%
]
8.79%
42196.2%
[
9.0%
-
9.5%
]
9.05%
43190.7%
[
10.0%
-
10.5%
]
10.00%
50100.0%
[
10.5%
-
11.0%
]
10.77%
19594.8%
[
13.5%
-
14.0%
]
13.51%
7477.0%
[
15.0%
-
15.5%
]
15.04%
83883.6%
[
24.0%
-
24.5%
]
24.27%
10398.1%
[
33.0%
-
33.5%
]
33.10%
14291.5%