Immigrants from Netherlands Self-Care Disability
COMPARE
Immigrants from Netherlands
Select to Compare
Self-Care Disability
Immigrants from Netherlands Self-Care Disability
2.3%
SELF-CARE DISABILITY
99.1/ 100
METRIC RATING
75th/ 347
METRIC RANK
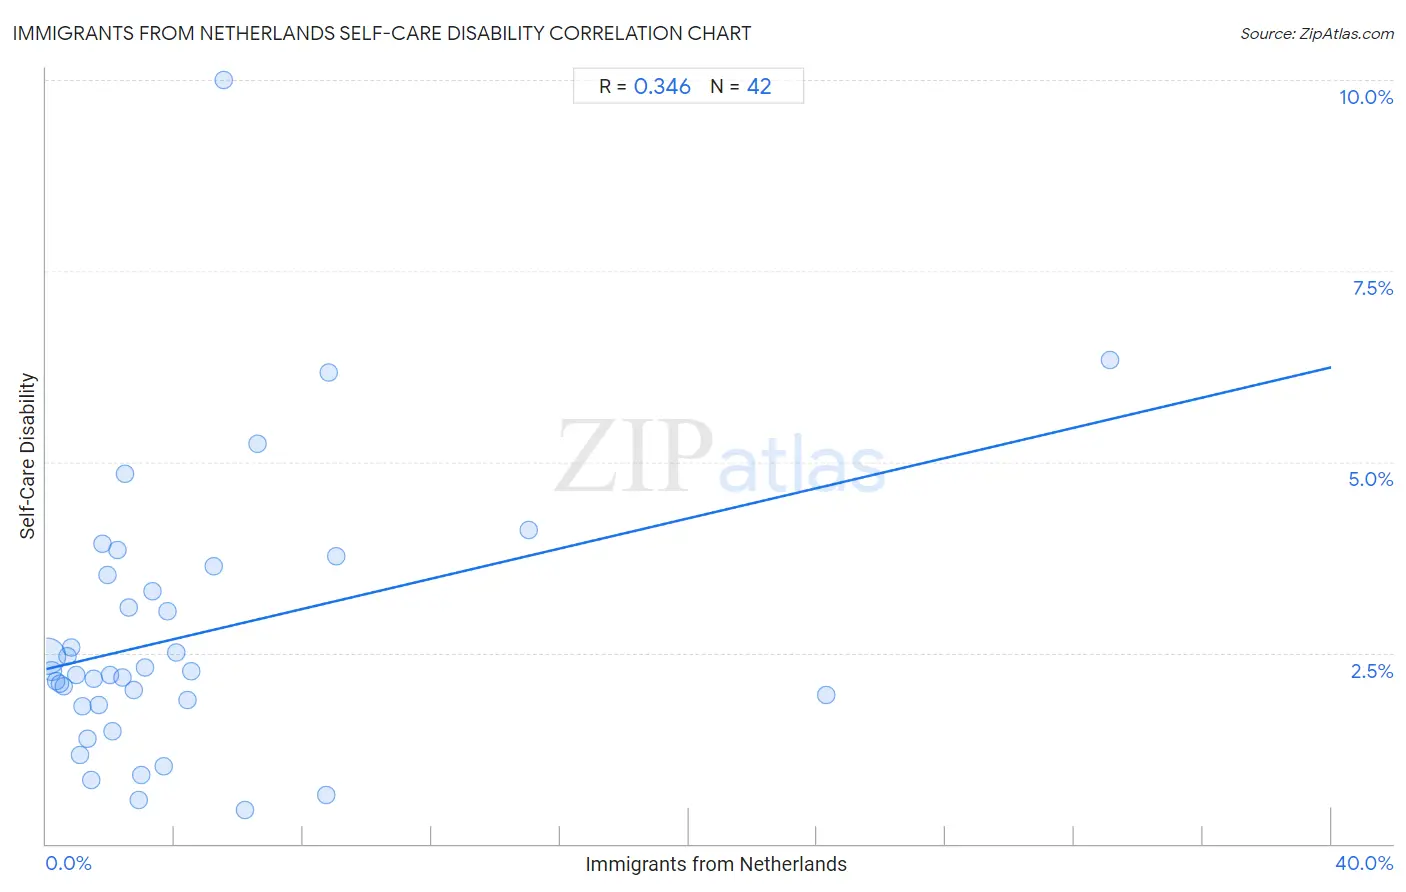
Immigrants from Netherlands Self-Care Disability Correlation Chart
The statistical analysis conducted on geographies consisting of 237,728,071 people shows a mild positive correlation between the proportion of Immigrants from Netherlands and percentage of population with self-care disability in the United States with a correlation coefficient (R) of 0.346 and weighted average of 2.3%. On average, for every 1% (one percent) increase in Immigrants from Netherlands within a typical geography, there is an increase of 0.099% in percentage of population with self-care disability.
It is essential to understand that the correlation between the percentage of Immigrants from Netherlands and percentage of population with self-care disability does not imply a direct cause-and-effect relationship. It remains uncertain whether the presence of Immigrants from Netherlands influences an upward or downward trend in the level of percentage of population with self-care disability within an area, or if Immigrants from Netherlands simply ended up residing in those areas with higher or lower levels of percentage of population with self-care disability due to other factors.
Demographics Similar to Immigrants from Netherlands by Self-Care Disability
In terms of self-care disability, the demographic groups most similar to Immigrants from Netherlands are Immigrants from China (2.3%, a difference of 0.010%), Immigrants from Switzerland (2.3%, a difference of 0.040%), Immigrants from Middle Africa (2.3%, a difference of 0.090%), Immigrants from Ireland (2.3%, a difference of 0.090%), and Immigrants from Egypt (2.3%, a difference of 0.10%).
| Demographics | Rating | Rank | Self-Care Disability |
| Immigrants from Zaire | 99.2 /100 | #68 | Exceptional 2.3% |
| Immigrants from Norway | 99.2 /100 | #69 | Exceptional 2.3% |
| Immigrants from Northern Europe | 99.2 /100 | #70 | Exceptional 2.3% |
| Asians | 99.2 /100 | #71 | Exceptional 2.3% |
| Eastern Europeans | 99.2 /100 | #72 | Exceptional 2.3% |
| Immigrants from Egypt | 99.1 /100 | #73 | Exceptional 2.3% |
| Immigrants from Switzerland | 99.1 /100 | #74 | Exceptional 2.3% |
| Immigrants from Netherlands | 99.1 /100 | #75 | Exceptional 2.3% |
| Immigrants from China | 99.1 /100 | #76 | Exceptional 2.3% |
| Immigrants from Middle Africa | 99.0 /100 | #77 | Exceptional 2.3% |
| Immigrants from Ireland | 99.0 /100 | #78 | Exceptional 2.3% |
| Immigrants from Kenya | 99.0 /100 | #79 | Exceptional 2.3% |
| Chileans | 98.8 /100 | #80 | Exceptional 2.3% |
| Ugandans | 98.8 /100 | #81 | Exceptional 2.3% |
| Immigrants from Denmark | 98.8 /100 | #82 | Exceptional 2.3% |
Immigrants from Netherlands Self-Care Disability Correlation Summary
| Measurement | Immigrants from Netherlands Data | Self-Care Disability Data |
| Minimum | 0.037% | 0.45% |
| Maximum | 33.1% | 10.0% |
| Range | 33.1% | 9.5% |
| Mean | 4.5% | 2.7% |
| Median | 2.5% | 2.2% |
| Interquartile 25% (IQ1) | 1.3% | 1.8% |
| Interquartile 75% (IQ3) | 4.5% | 3.5% |
| Interquartile Range (IQR) | 3.2% | 1.7% |
| Standard Deviation (Sample) | 6.3% | 1.8% |
| Standard Deviation (Population) | 6.2% | 1.8% |
Correlation Details
| Immigrants from Netherlands Percentile | Sample Size | Self-Care Disability |
[ 0.0% - 0.5% ] 0.037% | 210,948,574 | 2.5% |
[ 0.0% - 0.5% ] 0.17% | 18,860,457 | 2.3% |
[ 0.0% - 0.5% ] 0.29% | 4,439,923 | 2.1% |
[ 0.0% - 0.5% ] 0.42% | 1,578,932 | 2.1% |
[ 0.5% - 1.0% ] 0.54% | 651,094 | 2.1% |
[ 0.5% - 1.0% ] 0.67% | 358,429 | 2.5% |
[ 0.5% - 1.0% ] 0.79% | 348,332 | 2.6% |
[ 0.5% - 1.0% ] 0.93% | 99,070 | 2.2% |
[ 1.0% - 1.5% ] 1.05% | 121,237 | 1.2% |
[ 1.0% - 1.5% ] 1.15% | 68,757 | 1.8% |
[ 1.0% - 1.5% ] 1.29% | 43,508 | 1.4% |
[ 1.0% - 1.5% ] 1.40% | 55,911 | 0.83% |
[ 1.0% - 1.5% ] 1.49% | 35,093 | 2.2% |
[ 1.5% - 2.0% ] 1.64% | 15,395 | 1.8% |
[ 1.5% - 2.0% ] 1.74% | 11,101 | 3.9% |
[ 1.5% - 2.0% ] 1.89% | 5,186 | 3.5% |
[ 2.0% - 2.5% ] 2.00% | 10,949 | 2.2% |
[ 2.0% - 2.5% ] 2.07% | 25,115 | 1.5% |
[ 2.0% - 2.5% ] 2.23% | 3,363 | 3.8% |
[ 2.0% - 2.5% ] 2.38% | 15,141 | 2.2% |
[ 2.0% - 2.5% ] 2.45% | 5,097 | 4.8% |
[ 2.5% - 3.0% ] 2.57% | 4,908 | 3.1% |
[ 2.5% - 3.0% ] 2.74% | 2,228 | 2.0% |
[ 2.5% - 3.0% ] 2.89% | 2,527 | 0.57% |
[ 2.5% - 3.0% ] 2.97% | 673 | 0.90% |
[ 3.0% - 3.5% ] 3.06% | 4,118 | 2.3% |
[ 3.0% - 3.5% ] 3.31% | 151 | 3.3% |
[ 3.5% - 4.0% ] 3.67% | 409 | 1.0% |
[ 3.5% - 4.0% ] 3.77% | 875 | 3.1% |
[ 4.0% - 4.5% ] 4.04% | 4,161 | 2.5% |
[ 4.0% - 4.5% ] 4.39% | 797 | 1.9% |
[ 4.5% - 5.0% ] 4.51% | 576 | 2.3% |
[ 5.0% - 5.5% ] 5.23% | 746 | 3.6% |
[ 5.5% - 6.0% ] 5.53% | 778 | 10.0% |
[ 6.0% - 6.5% ] 6.18% | 1,359 | 0.45% |
[ 6.5% - 7.0% ] 6.59% | 501 | 5.2% |
[ 8.5% - 9.0% ] 8.72% | 963 | 0.64% |
[ 8.5% - 9.0% ] 8.79% | 421 | 6.2% |
[ 9.0% - 9.5% ] 9.02% | 133 | 3.8% |
[ 15.0% - 15.5% ] 15.04% | 838 | 4.1% |
[ 24.0% - 24.5% ] 24.27% | 103 | 1.9% |
[ 33.0% - 33.5% ] 33.10% | 142 | 6.3% |