Immigrants from Netherlands 4 or more Vehicles in Household

COMPARE

Immigrants from Netherlands
Race
Ancestry
AfghanAfricanAlaska NativeAlaskan AthabascanAlbanianAleutAlsatianAmericanApacheArabArapahoArgentineanArmenianAssyrian/Chaldean/SyriacAustralianAustrianBahamianBangladeshiBarbadianBasqueBelgianBelizeanBermudanBhutaneseBlackfeetBolivianBrazilianBritishBritish West IndianBulgarianBurmeseCajunCambodianCanadianCape VerdeanCarpatho RusynCelticCentral AmericanCentral American IndianCherokeeCheyenneChickasawChileanChineseChippewaChoctawColombianColvilleComancheCosta RicanCreeCreekCroatianCrowCubanCypriotCzechCzechoslovakianDanishDelawareDominicanDutchDutch West IndianEastern EuropeanEcuadorianEgyptianEnglishEstonianEthiopianEuropeanFijianFilipinoFinnishFrenchFrench American IndianFrench CanadianGermanGerman RussianGhanaianGreekGuamanian/ChamorroGuatemalanGuyaneseHaitianHmongHonduranHopiHoumaHungarianIcelanderIndian (Asian)IndonesianInupiatIranianIraqiIrishIroquoisIsraeliItalianJamaicanJapaneseJordanianKenyanKiowaKoreanLaotianLatvianLebaneseLiberianLithuanianLumbeeLuxembourgerMacedonianMalaysianMalteseMarshalleseMenomineeMexicanMexican American IndianMongolianMoroccanNative HawaiianNavajoNepaleseNew ZealanderNicaraguanNigerianNorthern EuropeanNorwegianOkinawanOsageOttawaPaiutePakistaniPalestinianPanamanianParaguayanPennsylvania GermanPeruvianPimaPolishPortuguesePotawatomiPuebloPuerto RicanPuget Sound SalishRomanianRussianSalvadoranSamoanScandinavianScotch-IrishScottishSeminoleSenegaleseSerbianShoshoneSierra LeoneanSiouxSlavicSlovakSloveneSomaliSouth AfricanSouth AmericanSouth American IndianSoviet UnionSpaniardSpanishSpanish AmericanSpanish American IndianSri LankanSubsaharan AfricanSudaneseSwedishSwissSyrianTaiwaneseThaiTlingit-HaidaTohono O'OdhamTonganTrinidadian and TobagonianTsimshianTurkishU.S. Virgin IslanderUgandanUkrainianUruguayanUteVenezuelanVietnameseWelshWest IndianYakamaYaquiYugoslavianYumanYup'ikZimbabwean
Immigration
NonimmigrantsImmigrantsAfghanistanAfricaAlbaniaArgentinaArmeniaAsiaAustraliaAustriaBahamasBangladeshBarbadosBelarusBelgiumBelizeBoliviaBosnia and HerzegovinaBrazilBulgariaBurma/MyanmarCabo VerdeCambodiaCameroonCanadaCaribbeanCentral AmericaChileChinaColombiaCongoCosta RicaCroatiaCubaCzechoslovakiaDenmarkDominicaDominican RepublicEastern AfricaEastern AsiaEastern EuropeEcuadorEgyptEl SalvadorEnglandEritreaEthiopiaEuropeFijiFranceGermanyGhanaGreeceGrenadaGuatemalaGuyanaHaitiHondurasHong KongHungaryIndiaIndonesiaIranIraqIrelandIsraelItalyJamaicaJapanJordanKazakhstanKenyaKoreaKuwaitLaosLatin AmericaLatviaLebanonLiberiaLithuaniaMalaysiaMexicoMicronesiaMiddle AfricaMoldovaMoroccoNepalNetherlandsNicaraguaNigeriaNorth AmericaNorth MacedoniaNorthern AfricaNorthern EuropeNorwayOceaniaPakistanPanamaPeruPhilippinesPolandPortugalRomaniaRussiaSaudi ArabiaScotlandSenegalSerbiaSierra LeoneSingaporeSomaliaSouth AfricaSouth AmericaSouth Central AsiaSouth Eastern AsiaSouthern EuropeSpainSri LankaSt. Vincent and the GrenadinesSudanSwedenSwitzerlandSyriaTaiwanThailandTrinidad and TobagoTurkeyUgandaUkraineUruguayUzbekistanVenezuelaVietnamWest IndiesWestern AfricaWestern AsiaWestern EuropeYemenZaireZimbabweAzores
Select to Compare
Race
Ancestry
AfghanAfricanAlaska NativeAlaskan AthabascanAlbanianAleutAlsatianAmericanApacheArabArapahoArgentineanArmenianAssyrian/Chaldean/SyriacAustralianAustrianBahamianBangladeshiBarbadianBasqueBelgianBelizeanBermudanBhutaneseBlackfeetBolivianBrazilianBritishBritish West IndianBulgarianBurmeseCajunCambodianCanadianCape VerdeanCarpatho RusynCelticCentral AmericanCentral American IndianCherokeeCheyenneChickasawChileanChineseChippewaChoctawColombianColvilleComancheCosta RicanCreeCreekCroatianCrowCubanCypriotCzechCzechoslovakianDanishDelawareDominicanDutchDutch West IndianEastern EuropeanEcuadorianEgyptianEnglishEstonianEthiopianEuropeanFijianFilipinoFinnishFrenchFrench American IndianFrench CanadianGermanGerman RussianGhanaianGreekGuamanian/ChamorroGuatemalanGuyaneseHaitianHmongHonduranHopiHoumaHungarianIcelanderIndian (Asian)IndonesianInupiatIranianIraqiIrishIroquoisIsraeliItalianJamaicanJapaneseJordanianKenyanKiowaKoreanLaotianLatvianLebaneseLiberianLithuanianLumbeeLuxembourgerMacedonianMalaysianMalteseMarshalleseMenomineeMexicanMexican American IndianMongolianMoroccanNative HawaiianNavajoNepaleseNew ZealanderNicaraguanNigerianNorthern EuropeanNorwegianOkinawanOsageOttawaPaiutePakistaniPalestinianPanamanianParaguayanPennsylvania GermanPeruvianPimaPolishPortuguesePotawatomiPuebloPuerto RicanPuget Sound SalishRomanianRussianSalvadoranSamoanScandinavianScotch-IrishScottishSeminoleSenegaleseSerbianShoshoneSierra LeoneanSiouxSlavicSlovakSloveneSomaliSouth AfricanSouth AmericanSouth American IndianSoviet UnionSpaniardSpanishSpanish AmericanSpanish American IndianSri LankanSubsaharan AfricanSudaneseSwedishSwissSyrianTaiwaneseThaiTlingit-HaidaTohono O'OdhamTonganTrinidadian and TobagonianTsimshianTurkishU.S. Virgin IslanderUgandanUkrainianUruguayanUteVenezuelanVietnameseWelshWest IndianYakamaYaquiYugoslavianYumanYup'ikZimbabwean
Immigration
NonimmigrantsImmigrantsAfghanistanAfricaAlbaniaArgentinaArmeniaAsiaAustraliaAustriaBahamasBangladeshBarbadosBelarusBelgiumBelizeBoliviaBosnia and HerzegovinaBrazilBulgariaBurma/MyanmarCabo VerdeCambodiaCameroonCanadaCaribbeanCentral AmericaChileChinaColombiaCongoCosta RicaCroatiaCubaCzechoslovakiaDenmarkDominicaDominican RepublicEastern AfricaEastern AsiaEastern EuropeEcuadorEgyptEl SalvadorEnglandEritreaEthiopiaEuropeFijiFranceGermanyGhanaGreeceGrenadaGuatemalaGuyanaHaitiHondurasHong KongHungaryIndiaIndonesiaIranIraqIrelandIsraelItalyJamaicaJapanJordanKazakhstanKenyaKoreaKuwaitLaosLatin AmericaLatviaLebanonLiberiaLithuaniaMalaysiaMexicoMicronesiaMiddle AfricaMoldovaMoroccoNepalNicaraguaNigeriaNorth AmericaNorth MacedoniaNorthern AfricaNorthern EuropeNorwayOceaniaPakistanPanamaPeruPhilippinesPolandPortugalRomaniaRussiaSaudi ArabiaScotlandSenegalSerbiaSierra LeoneSingaporeSomaliaSouth AfricaSouth AmericaSouth Central AsiaSouth Eastern AsiaSouthern EuropeSpainSri LankaSt. Vincent and the GrenadinesSudanSwedenSwitzerlandSyriaTaiwanThailandTrinidad and TobagoTurkeyUgandaUkraineUruguayUzbekistanVenezuelaVietnamWest IndiesWestern AfricaWestern AsiaWestern EuropeYemenZaireZimbabweAzores
4 or more Vehicles in Household
Income
Poverty
Unemployment
Labor Participation
Family Structure
Vehicle Availability
Education Level
Disability

Immigrants from Netherlands 4 or more Vehicles in Household
Excellent

6.6%
4+ VEHICLES AVAILABLE
87.8/ 100
METRIC RATING
132nd/ 347
METRIC RANK

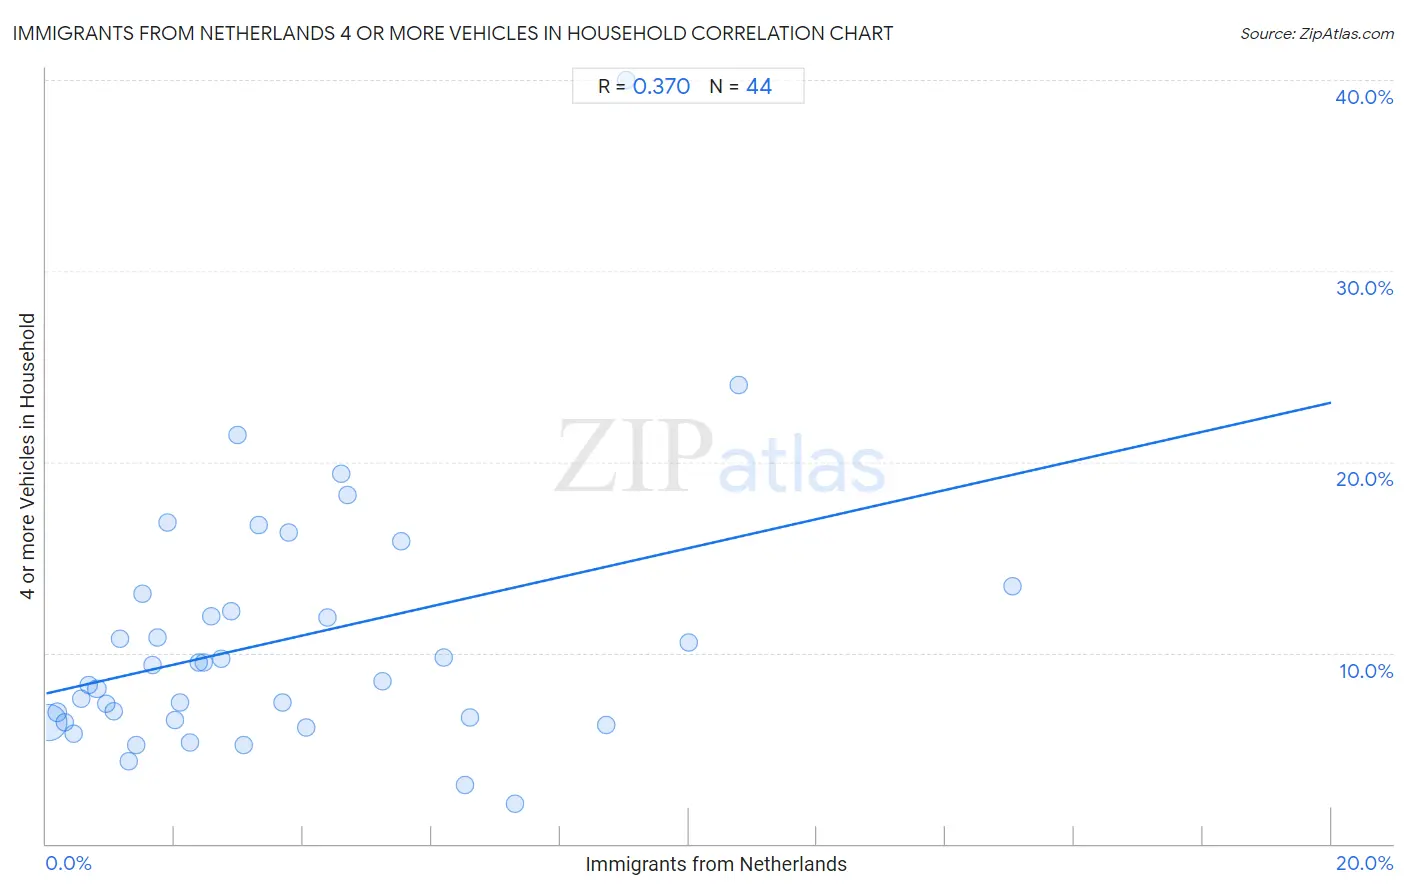
Immigrants from Netherlands 4 or more Vehicles in Household Correlation Chart

The statistical analysis conducted on geographies consisting of 237,226,549 people shows a mild positive correlation between the proportion of Immigrants from Netherlands and percentage of households with 4 or more vehicles available in the United States with a correlation coefficient (R) of 0.370 and weighted average of 6.6%. On average, for every 1% (one percent) increase in Immigrants from Netherlands within a typical geography, there is an increase of 0.76% in percentage of households with 4 or more vehicles available.
Immigrants from Netherlands 4 or more Vehicles in Household
It is essential to understand that the correlation between the percentage of Immigrants from Netherlands and percentage of households with 4 or more vehicles available does not imply a direct cause-and-effect relationship. It remains uncertain whether the presence of Immigrants from Netherlands influences an upward or downward trend in the level of percentage of households with 4 or more vehicles available within an area, or if Immigrants from Netherlands simply ended up residing in those areas with higher or lower levels of percentage of households with 4 or more vehicles available due to other factors.

Demographics Similar to Immigrants from Netherlands by 4 or more Vehicles in Household

In terms of 4 or more vehicles in household, the demographic groups most similar to Immigrants from Netherlands are Maltese (6.7%, a difference of 0.14%), Armenian (6.6%, a difference of 0.19%), Ottawa (6.6%, a difference of 0.21%), Tohono O'odham (6.6%, a difference of 0.24%), and Immigrants from Scotland (6.7%, a difference of 0.29%).
DemographicsRating | Rank4 or more Vehicles in Household
Austrians
94.1
/100
|
#125
Exceptional
6.8%
Belgians
94.1
/100
|
#126
Exceptional
6.8%
Immigrants from Korea
93.8
/100
|
#127
Exceptional
6.8%
Immigrants from Bolivia
92.5
/100
|
#128
Exceptional
6.7%
Immigrants from England
92.0
/100
|
#129
Exceptional
6.7%
Immigrants from Scotland
89.0
/100
|
#130
Excellent
6.7%
Maltese
88.4
/100
|
#131
Excellent
6.7%
Immigrants from Netherlands
87.8
/100
|
#132
Excellent
6.6%
Armenians
86.9
/100
|
#133
Excellent
6.6%
Ottawa
86.9
/100
|
#134
Excellent
6.6%
Tohono O'odham
86.7
/100
|
#135
Excellent
6.6%
Luxembourgers
86.4
/100
|
#136
Excellent
6.6%
French Canadians
85.4
/100
|
#137
Excellent
6.6%
Italians
84.5
/100
|
#138
Excellent
6.6%
Jordanians
82.1
/100
|
#139
Excellent
6.6%

Immigrants from Netherlands 4 or more Vehicles in Household Correlation Summary

MeasurementImmigrants from Netherlands Data4 or more Vehicles in Household Data
Minimum0.037%2.1%
Maximum15.0%40.0%
Range15.0%37.9%
Mean3.6%10.6%
Median2.6%8.9%
Interquartile 25% (IQ1)1.3%6.4%
Interquartile 75% (IQ3)5.0%12.6%
Interquartile Range (IQR)3.6%6.2%
Standard Deviation (Sample)3.3%6.7%
Standard Deviation (Population)3.2%6.6%

Correlation Details

Immigrants from Netherlands PercentileSample Size4 or more Vehicles in Household
[
0.0%
-
0.5%
]
0.037%
210,678,2576.3%
[
0.0%
-
0.5%
]
0.17%
18,656,1816.9%
[
0.0%
-
0.5%
]
0.29%
4,420,1846.4%
[
0.0%
-
0.5%
]
0.42%
1,579,2595.8%
[
0.5%
-
1.0%
]
0.54%
640,4237.6%
[
0.5%
-
1.0%
]
0.67%
350,2318.3%
[
0.5%
-
1.0%
]
0.79%
342,4148.1%
[
0.5%
-
1.0%
]
0.93%
99,8947.3%
[
1.0%
-
1.5%
]
1.05%
124,9017.0%
[
1.0%
-
1.5%
]
1.15%
69,93910.7%
[
1.0%
-
1.5%
]
1.29%
49,4794.3%
[
1.0%
-
1.5%
]
1.40%
55,9115.2%
[
1.0%
-
1.5%
]
1.49%
35,09313.1%
[
1.5%
-
2.0%
]
1.65%
11,9129.3%
[
1.5%
-
2.0%
]
1.74%
11,10110.8%
[
1.5%
-
2.0%
]
1.89%
3,97116.9%
[
1.5%
-
2.0%
]
2.00%
12,0646.5%
[
2.0%
-
2.5%
]
2.07%
25,1157.4%
[
2.0%
-
2.5%
]
2.24%
3,9765.3%
[
2.0%
-
2.5%
]
2.38%
15,1419.5%
[
2.0%
-
2.5%
]
2.45%
5,0979.5%
[
2.5%
-
3.0%
]
2.57%
7,09111.9%
[
2.5%
-
3.0%
]
2.72%
4,2609.7%
[
2.5%
-
3.0%
]
2.89%
2,52712.2%
[
2.5%
-
3.0%
]
2.97%
67321.4%
[
3.0%
-
3.5%
]
3.07%
5,3675.2%
[
3.0%
-
3.5%
]
3.31%
15116.7%
[
3.5%
-
4.0%
]
3.67%
4097.4%
[
3.5%
-
4.0%
]
3.77%
1,19316.3%
[
4.0%
-
4.5%
]
4.04%
4,1616.1%
[
4.0%
-
4.5%
]
4.39%
1,14011.9%
[
4.5%
-
5.0%
]
4.60%
8719.4%
[
4.5%
-
5.0%
]
4.68%
2,77818.3%
[
5.0%
-
5.5%
]
5.23%
8988.5%
[
5.5%
-
6.0%
]
5.53%
77815.8%
[
6.0%
-
6.5%
]
6.18%
1,3599.7%
[
6.5%
-
7.0%
]
6.52%
2763.1%
[
6.5%
-
7.0%
]
6.59%
5016.6%
[
7.0%
-
7.5%
]
7.30%
1782.1%
[
8.5%
-
9.0%
]
8.72%
9636.2%
[
9.0%
-
9.5%
]
9.02%
13340.0%
[
10.0%
-
10.5%
]
10.00%
5010.5%
[
10.5%
-
11.0%
]
10.77%
19524.0%
[
15.0%
-
15.5%
]
15.04%
83813.5%