Immigrants from Netherlands Wage/Income Gap

COMPARE

Immigrants from Netherlands
Race
Ancestry
AfghanAfricanAlaska NativeAlaskan AthabascanAlbanianAleutAlsatianAmericanApacheArabArapahoArgentineanArmenianAssyrian/Chaldean/SyriacAustralianAustrianBahamianBangladeshiBarbadianBasqueBelgianBelizeanBermudanBhutaneseBlackfeetBolivianBrazilianBritishBritish West IndianBulgarianBurmeseCajunCambodianCanadianCape VerdeanCarpatho RusynCelticCentral AmericanCentral American IndianCherokeeCheyenneChickasawChileanChineseChippewaChoctawColombianColvilleComancheCosta RicanCreeCreekCroatianCrowCubanCypriotCzechCzechoslovakianDanishDelawareDominicanDutchDutch West IndianEastern EuropeanEcuadorianEgyptianEnglishEstonianEthiopianEuropeanFijianFilipinoFinnishFrenchFrench American IndianFrench CanadianGermanGerman RussianGhanaianGreekGuamanian/ChamorroGuatemalanGuyaneseHaitianHmongHonduranHopiHoumaHungarianIcelanderIndian (Asian)IndonesianInupiatIranianIraqiIrishIroquoisIsraeliItalianJamaicanJapaneseJordanianKenyanKiowaKoreanLaotianLatvianLebaneseLiberianLithuanianLumbeeLuxembourgerMacedonianMalaysianMalteseMarshalleseMenomineeMexicanMexican American IndianMongolianMoroccanNative HawaiianNavajoNepaleseNew ZealanderNicaraguanNigerianNorthern EuropeanNorwegianOkinawanOsageOttawaPaiutePakistaniPalestinianPanamanianParaguayanPennsylvania GermanPeruvianPimaPolishPortuguesePotawatomiPuebloPuerto RicanPuget Sound SalishRomanianRussianSalvadoranSamoanScandinavianScotch-IrishScottishSeminoleSenegaleseSerbianShoshoneSierra LeoneanSiouxSlavicSlovakSloveneSomaliSouth AfricanSouth AmericanSouth American IndianSoviet UnionSpaniardSpanishSpanish AmericanSpanish American IndianSri LankanSubsaharan AfricanSudaneseSwedishSwissSyrianTaiwaneseThaiTlingit-HaidaTohono O'OdhamTonganTrinidadian and TobagonianTsimshianTurkishU.S. Virgin IslanderUgandanUkrainianUruguayanUteVenezuelanVietnameseWelshWest IndianYakamaYaquiYugoslavianYumanYup'ikZimbabwean
Immigration
NonimmigrantsImmigrantsAfghanistanAfricaAlbaniaArgentinaArmeniaAsiaAustraliaAustriaBahamasBangladeshBarbadosBelarusBelgiumBelizeBoliviaBosnia and HerzegovinaBrazilBulgariaBurma/MyanmarCabo VerdeCambodiaCameroonCanadaCaribbeanCentral AmericaChileChinaColombiaCongoCosta RicaCroatiaCubaCzechoslovakiaDenmarkDominicaDominican RepublicEastern AfricaEastern AsiaEastern EuropeEcuadorEgyptEl SalvadorEnglandEritreaEthiopiaEuropeFijiFranceGermanyGhanaGreeceGrenadaGuatemalaGuyanaHaitiHondurasHong KongHungaryIndiaIndonesiaIranIraqIrelandIsraelItalyJamaicaJapanJordanKazakhstanKenyaKoreaKuwaitLaosLatin AmericaLatviaLebanonLiberiaLithuaniaMalaysiaMexicoMicronesiaMiddle AfricaMoldovaMoroccoNepalNetherlandsNicaraguaNigeriaNorth AmericaNorth MacedoniaNorthern AfricaNorthern EuropeNorwayOceaniaPakistanPanamaPeruPhilippinesPolandPortugalRomaniaRussiaSaudi ArabiaScotlandSenegalSerbiaSierra LeoneSingaporeSomaliaSouth AfricaSouth AmericaSouth Central AsiaSouth Eastern AsiaSouthern EuropeSpainSri LankaSt. Vincent and the GrenadinesSudanSwedenSwitzerlandSyriaTaiwanThailandTrinidad and TobagoTurkeyUgandaUkraineUruguayUzbekistanVenezuelaVietnamWest IndiesWestern AfricaWestern AsiaWestern EuropeYemenZaireZimbabweAzores
Select to Compare
Race
Ancestry
AfghanAfricanAlaska NativeAlaskan AthabascanAlbanianAleutAlsatianAmericanApacheArabArapahoArgentineanArmenianAssyrian/Chaldean/SyriacAustralianAustrianBahamianBangladeshiBarbadianBasqueBelgianBelizeanBermudanBhutaneseBlackfeetBolivianBrazilianBritishBritish West IndianBulgarianBurmeseCajunCambodianCanadianCape VerdeanCarpatho RusynCelticCentral AmericanCentral American IndianCherokeeCheyenneChickasawChileanChineseChippewaChoctawColombianColvilleComancheCosta RicanCreeCreekCroatianCrowCubanCypriotCzechCzechoslovakianDanishDelawareDominicanDutchDutch West IndianEastern EuropeanEcuadorianEgyptianEnglishEstonianEthiopianEuropeanFijianFilipinoFinnishFrenchFrench American IndianFrench CanadianGermanGerman RussianGhanaianGreekGuamanian/ChamorroGuatemalanGuyaneseHaitianHmongHonduranHopiHoumaHungarianIcelanderIndian (Asian)IndonesianInupiatIranianIraqiIrishIroquoisIsraeliItalianJamaicanJapaneseJordanianKenyanKiowaKoreanLaotianLatvianLebaneseLiberianLithuanianLumbeeLuxembourgerMacedonianMalaysianMalteseMarshalleseMenomineeMexicanMexican American IndianMongolianMoroccanNative HawaiianNavajoNepaleseNew ZealanderNicaraguanNigerianNorthern EuropeanNorwegianOkinawanOsageOttawaPaiutePakistaniPalestinianPanamanianParaguayanPennsylvania GermanPeruvianPimaPolishPortuguesePotawatomiPuebloPuerto RicanPuget Sound SalishRomanianRussianSalvadoranSamoanScandinavianScotch-IrishScottishSeminoleSenegaleseSerbianShoshoneSierra LeoneanSiouxSlavicSlovakSloveneSomaliSouth AfricanSouth AmericanSouth American IndianSoviet UnionSpaniardSpanishSpanish AmericanSpanish American IndianSri LankanSubsaharan AfricanSudaneseSwedishSwissSyrianTaiwaneseThaiTlingit-HaidaTohono O'OdhamTonganTrinidadian and TobagonianTsimshianTurkishU.S. Virgin IslanderUgandanUkrainianUruguayanUteVenezuelanVietnameseWelshWest IndianYakamaYaquiYugoslavianYumanYup'ikZimbabwean
Immigration
NonimmigrantsImmigrantsAfghanistanAfricaAlbaniaArgentinaArmeniaAsiaAustraliaAustriaBahamasBangladeshBarbadosBelarusBelgiumBelizeBoliviaBosnia and HerzegovinaBrazilBulgariaBurma/MyanmarCabo VerdeCambodiaCameroonCanadaCaribbeanCentral AmericaChileChinaColombiaCongoCosta RicaCroatiaCubaCzechoslovakiaDenmarkDominicaDominican RepublicEastern AfricaEastern AsiaEastern EuropeEcuadorEgyptEl SalvadorEnglandEritreaEthiopiaEuropeFijiFranceGermanyGhanaGreeceGrenadaGuatemalaGuyanaHaitiHondurasHong KongHungaryIndiaIndonesiaIranIraqIrelandIsraelItalyJamaicaJapanJordanKazakhstanKenyaKoreaKuwaitLaosLatin AmericaLatviaLebanonLiberiaLithuaniaMalaysiaMexicoMicronesiaMiddle AfricaMoldovaMoroccoNepalNicaraguaNigeriaNorth AmericaNorth MacedoniaNorthern AfricaNorthern EuropeNorwayOceaniaPakistanPanamaPeruPhilippinesPolandPortugalRomaniaRussiaSaudi ArabiaScotlandSenegalSerbiaSierra LeoneSingaporeSomaliaSouth AfricaSouth AmericaSouth Central AsiaSouth Eastern AsiaSouthern EuropeSpainSri LankaSt. Vincent and the GrenadinesSudanSwedenSwitzerlandSyriaTaiwanThailandTrinidad and TobagoTurkeyUgandaUkraineUruguayUzbekistanVenezuelaVietnamWest IndiesWestern AfricaWestern AsiaWestern EuropeYemenZaireZimbabweAzores
Wage/Income Gap
Income
Poverty
Unemployment
Labor Participation
Family Structure
Vehicle Availability
Education Level
Disability

Immigrants from Netherlands Wage/Income Gap
Tragic

28.5%
WAGE/INCOME GAP
0.2/ 100
METRIC RATING
304th/ 347
METRIC RANK

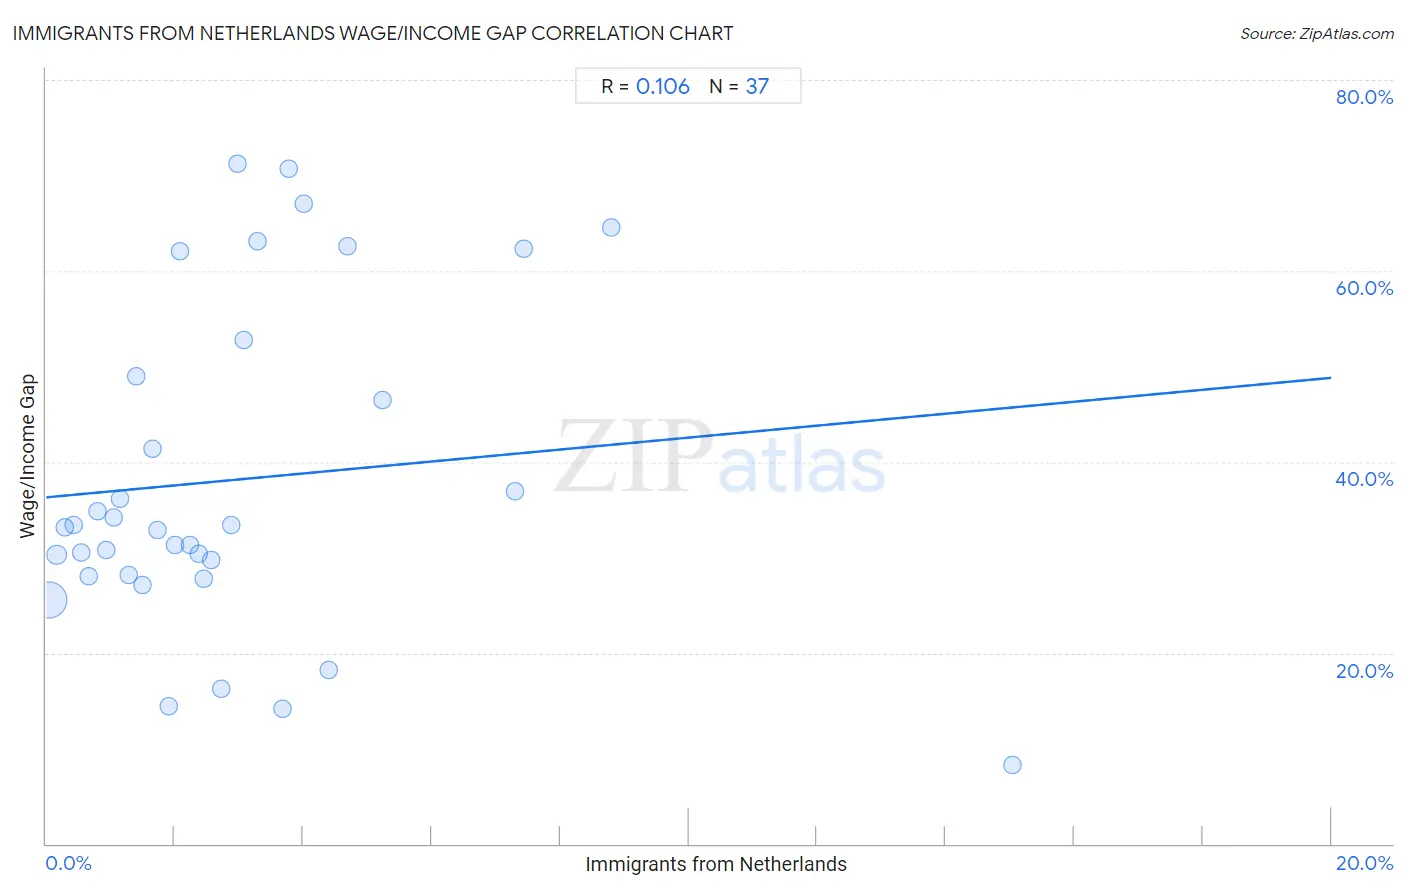
Immigrants from Netherlands Wage/Income Gap Correlation Chart

The statistical analysis conducted on geographies consisting of 237,766,220 people shows a poor positive correlation between the proportion of Immigrants from Netherlands and wage/income gap percentage in the United States with a correlation coefficient (R) of 0.106 and weighted average of 28.5%. On average, for every 1% (one percent) increase in Immigrants from Netherlands within a typical geography, there is an increase of 0.63% in wage/income gap percentage.
Immigrants from Netherlands Wage/Income Gap
It is essential to understand that the correlation between the percentage of Immigrants from Netherlands and wage/income gap percentage does not imply a direct cause-and-effect relationship. It remains uncertain whether the presence of Immigrants from Netherlands influences an upward or downward trend in the level of wage/income gap percentage within an area, or if Immigrants from Netherlands simply ended up residing in those areas with higher or lower levels of wage/income gap percentage due to other factors.

Demographics Similar to Immigrants from Netherlands by Wage/Income Gap

In terms of wage/income gap, the demographic groups most similar to Immigrants from Netherlands are Immigrants from South Africa (28.5%, a difference of 0.020%), White/Caucasian (28.5%, a difference of 0.060%), Immigrants from Denmark (28.5%, a difference of 0.070%), Scotch-Irish (28.5%, a difference of 0.080%), and Irish (28.5%, a difference of 0.080%).
DemographicsRating | RankWage/Income Gap
Immigrants from North America
0.2
/100
|
#297
Tragic
28.4%
Austrians
0.2
/100
|
#298
Tragic
28.4%
Immigrants from North Macedonia
0.2
/100
|
#299
Tragic
28.4%
Immigrants from Northern Europe
0.2
/100
|
#300
Tragic
28.5%
Immigrants from Canada
0.2
/100
|
#301
Tragic
28.5%
Scotch-Irish
0.2
/100
|
#302
Tragic
28.5%
Irish
0.2
/100
|
#303
Tragic
28.5%
Immigrants from Netherlands
0.2
/100
|
#304
Tragic
28.5%
Immigrants from South Africa
0.1
/100
|
#305
Tragic
28.5%
Whites/Caucasians
0.1
/100
|
#306
Tragic
28.5%
Immigrants from Denmark
0.1
/100
|
#307
Tragic
28.5%
Poles
0.1
/100
|
#308
Tragic
28.5%
Macedonians
0.1
/100
|
#309
Tragic
28.6%
Finns
0.1
/100
|
#310
Tragic
28.6%
Immigrants from Lithuania
0.1
/100
|
#311
Tragic
28.6%

Immigrants from Netherlands Wage/Income Gap Correlation Summary

MeasurementImmigrants from Netherlands DataWage/Income Gap Data
Minimum0.037%8.2%
Maximum15.0%71.2%
Range15.0%63.0%
Mean2.9%38.1%
Median2.2%33.2%
Interquartile 25% (IQ1)1.1%28.1%
Interquartile 75% (IQ3)3.7%50.9%
Interquartile Range (IQR)2.6%22.8%
Standard Deviation (Sample)2.9%17.1%
Standard Deviation (Population)2.9%16.9%

Correlation Details

Immigrants from Netherlands PercentileSample SizeWage/Income Gap
[
0.0%
-
0.5%
]
0.037%
210,963,84725.5%
[
0.0%
-
0.5%
]
0.17%
18,884,20130.3%
[
0.0%
-
0.5%
]
0.29%
4,456,99933.2%
[
0.0%
-
0.5%
]
0.42%
1,577,57733.4%
[
0.5%
-
1.0%
]
0.54%
637,99230.6%
[
0.5%
-
1.0%
]
0.67%
361,09728.0%
[
0.5%
-
1.0%
]
0.79%
344,43934.9%
[
0.5%
-
1.0%
]
0.93%
98,40530.8%
[
1.0%
-
1.5%
]
1.05%
123,32334.2%
[
1.0%
-
1.5%
]
1.14%
70,40836.2%
[
1.0%
-
1.5%
]
1.29%
47,82028.2%
[
1.0%
-
1.5%
]
1.40%
56,68549.0%
[
1.0%
-
1.5%
]
1.49%
33,25227.1%
[
1.5%
-
2.0%
]
1.65%
11,10641.4%
[
1.5%
-
2.0%
]
1.74%
10,35432.9%
[
1.5%
-
2.0%
]
1.90%
2,20714.3%
[
1.5%
-
2.0%
]
2.00%
11,81631.2%
[
2.0%
-
2.5%
]
2.07%
22,75662.0%
[
2.0%
-
2.5%
]
2.23%
3,54231.3%
[
2.0%
-
2.5%
]
2.38%
13,08630.4%
[
2.0%
-
2.5%
]
2.45%
4,85427.8%
[
2.5%
-
3.0%
]
2.57%
7,32129.7%
[
2.5%
-
3.0%
]
2.73%
3,85116.2%
[
2.5%
-
3.0%
]
2.89%
2,52733.4%
[
2.5%
-
3.0%
]
2.97%
67371.2%
[
3.0%
-
3.5%
]
3.07%
4,72952.8%
[
3.0%
-
3.5%
]
3.29%
21363.1%
[
3.5%
-
4.0%
]
3.67%
40914.1%
[
3.5%
-
4.0%
]
3.78%
1,50870.6%
[
4.0%
-
4.5%
]
4.01%
2,46967.0%
[
4.0%
-
4.5%
]
4.39%
79718.1%
[
4.5%
-
5.0%
]
4.68%
2,77862.6%
[
5.0%
-
5.5%
]
5.23%
74646.5%
[
7.0%
-
7.5%
]
7.30%
17837.0%
[
7.0%
-
7.5%
]
7.43%
99662.4%
[
8.5%
-
9.0%
]
8.79%
42164.6%
[
15.0%
-
15.5%
]
15.04%
8388.2%