Immigrants from Netherlands Married-couple Households

COMPARE

Immigrants from Netherlands
Race
Ancestry
AfghanAfricanAlaska NativeAlaskan AthabascanAlbanianAleutAlsatianAmericanApacheArabArapahoArgentineanArmenianAssyrian/Chaldean/SyriacAustralianAustrianBahamianBangladeshiBarbadianBasqueBelgianBelizeanBermudanBhutaneseBlackfeetBolivianBrazilianBritishBritish West IndianBulgarianBurmeseCajunCambodianCanadianCape VerdeanCarpatho RusynCelticCentral AmericanCentral American IndianCherokeeCheyenneChickasawChileanChineseChippewaChoctawColombianColvilleComancheCosta RicanCreeCreekCroatianCrowCubanCypriotCzechCzechoslovakianDanishDelawareDominicanDutchDutch West IndianEastern EuropeanEcuadorianEgyptianEnglishEstonianEthiopianEuropeanFijianFilipinoFinnishFrenchFrench American IndianFrench CanadianGermanGerman RussianGhanaianGreekGuamanian/ChamorroGuatemalanGuyaneseHaitianHmongHonduranHopiHoumaHungarianIcelanderIndian (Asian)IndonesianInupiatIranianIraqiIrishIroquoisIsraeliItalianJamaicanJapaneseJordanianKenyanKiowaKoreanLaotianLatvianLebaneseLiberianLithuanianLumbeeLuxembourgerMacedonianMalaysianMalteseMarshalleseMenomineeMexicanMexican American IndianMongolianMoroccanNative HawaiianNavajoNepaleseNew ZealanderNicaraguanNigerianNorthern EuropeanNorwegianOkinawanOsageOttawaPaiutePakistaniPalestinianPanamanianParaguayanPennsylvania GermanPeruvianPimaPolishPortuguesePotawatomiPuebloPuerto RicanPuget Sound SalishRomanianRussianSalvadoranSamoanScandinavianScotch-IrishScottishSeminoleSenegaleseSerbianShoshoneSierra LeoneanSiouxSlavicSlovakSloveneSomaliSouth AfricanSouth AmericanSouth American IndianSoviet UnionSpaniardSpanishSpanish AmericanSpanish American IndianSri LankanSubsaharan AfricanSudaneseSwedishSwissSyrianTaiwaneseThaiTlingit-HaidaTohono O'OdhamTonganTrinidadian and TobagonianTsimshianTurkishU.S. Virgin IslanderUgandanUkrainianUruguayanUteVenezuelanVietnameseWelshWest IndianYakamaYaquiYugoslavianYumanYup'ikZimbabwean
Immigration
NonimmigrantsImmigrantsAfghanistanAfricaAlbaniaArgentinaArmeniaAsiaAustraliaAustriaBahamasBangladeshBarbadosBelarusBelgiumBelizeBoliviaBosnia and HerzegovinaBrazilBulgariaBurma/MyanmarCabo VerdeCambodiaCameroonCanadaCaribbeanCentral AmericaChileChinaColombiaCongoCosta RicaCroatiaCubaCzechoslovakiaDenmarkDominicaDominican RepublicEastern AfricaEastern AsiaEastern EuropeEcuadorEgyptEl SalvadorEnglandEritreaEthiopiaEuropeFijiFranceGermanyGhanaGreeceGrenadaGuatemalaGuyanaHaitiHondurasHong KongHungaryIndiaIndonesiaIranIraqIrelandIsraelItalyJamaicaJapanJordanKazakhstanKenyaKoreaKuwaitLaosLatin AmericaLatviaLebanonLiberiaLithuaniaMalaysiaMexicoMicronesiaMiddle AfricaMoldovaMoroccoNepalNetherlandsNicaraguaNigeriaNorth AmericaNorth MacedoniaNorthern AfricaNorthern EuropeNorwayOceaniaPakistanPanamaPeruPhilippinesPolandPortugalRomaniaRussiaSaudi ArabiaScotlandSenegalSerbiaSierra LeoneSingaporeSomaliaSouth AfricaSouth AmericaSouth Central AsiaSouth Eastern AsiaSouthern EuropeSpainSri LankaSt. Vincent and the GrenadinesSudanSwedenSwitzerlandSyriaTaiwanThailandTrinidad and TobagoTurkeyUgandaUkraineUruguayUzbekistanVenezuelaVietnamWest IndiesWestern AfricaWestern AsiaWestern EuropeYemenZaireZimbabweAzores
Select to Compare
Race
Ancestry
AfghanAfricanAlaska NativeAlaskan AthabascanAlbanianAleutAlsatianAmericanApacheArabArapahoArgentineanArmenianAssyrian/Chaldean/SyriacAustralianAustrianBahamianBangladeshiBarbadianBasqueBelgianBelizeanBermudanBhutaneseBlackfeetBolivianBrazilianBritishBritish West IndianBulgarianBurmeseCajunCambodianCanadianCape VerdeanCarpatho RusynCelticCentral AmericanCentral American IndianCherokeeCheyenneChickasawChileanChineseChippewaChoctawColombianColvilleComancheCosta RicanCreeCreekCroatianCrowCubanCypriotCzechCzechoslovakianDanishDelawareDominicanDutchDutch West IndianEastern EuropeanEcuadorianEgyptianEnglishEstonianEthiopianEuropeanFijianFilipinoFinnishFrenchFrench American IndianFrench CanadianGermanGerman RussianGhanaianGreekGuamanian/ChamorroGuatemalanGuyaneseHaitianHmongHonduranHopiHoumaHungarianIcelanderIndian (Asian)IndonesianInupiatIranianIraqiIrishIroquoisIsraeliItalianJamaicanJapaneseJordanianKenyanKiowaKoreanLaotianLatvianLebaneseLiberianLithuanianLumbeeLuxembourgerMacedonianMalaysianMalteseMarshalleseMenomineeMexicanMexican American IndianMongolianMoroccanNative HawaiianNavajoNepaleseNew ZealanderNicaraguanNigerianNorthern EuropeanNorwegianOkinawanOsageOttawaPaiutePakistaniPalestinianPanamanianParaguayanPennsylvania GermanPeruvianPimaPolishPortuguesePotawatomiPuebloPuerto RicanPuget Sound SalishRomanianRussianSalvadoranSamoanScandinavianScotch-IrishScottishSeminoleSenegaleseSerbianShoshoneSierra LeoneanSiouxSlavicSlovakSloveneSomaliSouth AfricanSouth AmericanSouth American IndianSoviet UnionSpaniardSpanishSpanish AmericanSpanish American IndianSri LankanSubsaharan AfricanSudaneseSwedishSwissSyrianTaiwaneseThaiTlingit-HaidaTohono O'OdhamTonganTrinidadian and TobagonianTsimshianTurkishU.S. Virgin IslanderUgandanUkrainianUruguayanUteVenezuelanVietnameseWelshWest IndianYakamaYaquiYugoslavianYumanYup'ikZimbabwean
Immigration
NonimmigrantsImmigrantsAfghanistanAfricaAlbaniaArgentinaArmeniaAsiaAustraliaAustriaBahamasBangladeshBarbadosBelarusBelgiumBelizeBoliviaBosnia and HerzegovinaBrazilBulgariaBurma/MyanmarCabo VerdeCambodiaCameroonCanadaCaribbeanCentral AmericaChileChinaColombiaCongoCosta RicaCroatiaCubaCzechoslovakiaDenmarkDominicaDominican RepublicEastern AfricaEastern AsiaEastern EuropeEcuadorEgyptEl SalvadorEnglandEritreaEthiopiaEuropeFijiFranceGermanyGhanaGreeceGrenadaGuatemalaGuyanaHaitiHondurasHong KongHungaryIndiaIndonesiaIranIraqIrelandIsraelItalyJamaicaJapanJordanKazakhstanKenyaKoreaKuwaitLaosLatin AmericaLatviaLebanonLiberiaLithuaniaMalaysiaMexicoMicronesiaMiddle AfricaMoldovaMoroccoNepalNicaraguaNigeriaNorth AmericaNorth MacedoniaNorthern AfricaNorthern EuropeNorwayOceaniaPakistanPanamaPeruPhilippinesPolandPortugalRomaniaRussiaSaudi ArabiaScotlandSenegalSerbiaSierra LeoneSingaporeSomaliaSouth AfricaSouth AmericaSouth Central AsiaSouth Eastern AsiaSouthern EuropeSpainSri LankaSt. Vincent and the GrenadinesSudanSwedenSwitzerlandSyriaTaiwanThailandTrinidad and TobagoTurkeyUgandaUkraineUruguayUzbekistanVenezuelaVietnamWest IndiesWestern AfricaWestern AsiaWestern EuropeYemenZaireZimbabweAzores
Married-couple Households
Income
Poverty
Unemployment
Labor Participation
Family Structure
Vehicle Availability
Education Level
Disability

Immigrants from Netherlands Married-couple Households
Exceptional

48.2%
MARRIED-COUPLE HOUSEHOLDS
98.2/ 100
METRIC RATING
79th/ 347
METRIC RANK

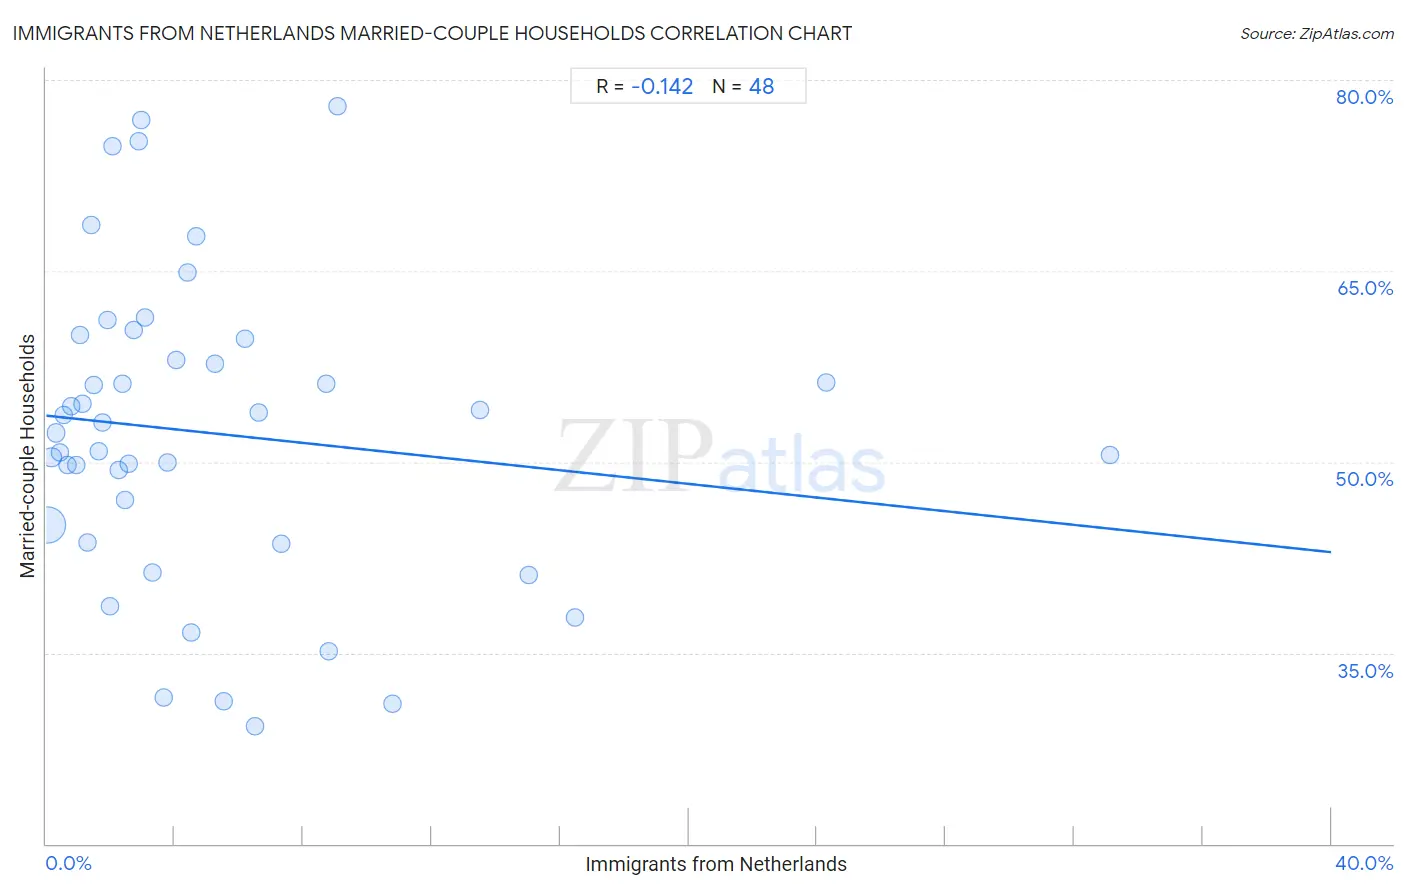
Immigrants from Netherlands Married-couple Households Correlation Chart

The statistical analysis conducted on geographies consisting of 237,797,342 people shows a poor negative correlation between the proportion of Immigrants from Netherlands and percentage of married-couple family households in the United States with a correlation coefficient (R) of -0.142 and weighted average of 48.2%. On average, for every 1% (one percent) increase in Immigrants from Netherlands within a typical geography, there is a decrease of 0.27% in percentage of married-couple family households.
Immigrants from Netherlands Married-couple Households
It is essential to understand that the correlation between the percentage of Immigrants from Netherlands and percentage of married-couple family households does not imply a direct cause-and-effect relationship. It remains uncertain whether the presence of Immigrants from Netherlands influences an upward or downward trend in the level of percentage of married-couple family households within an area, or if Immigrants from Netherlands simply ended up residing in those areas with higher or lower levels of percentage of married-couple family households due to other factors.

Demographics Similar to Immigrants from Netherlands by Married-couple Households

In terms of married-couple households, the demographic groups most similar to Immigrants from Netherlands are Egyptian (48.2%, a difference of 0.010%), Russian (48.2%, a difference of 0.020%), Canadian (48.2%, a difference of 0.030%), Finnish (48.1%, a difference of 0.090%), and Immigrants from Fiji (48.2%, a difference of 0.12%).
DemographicsRating | RankMarried-couple Households
Scotch-Irish
98.6
/100
|
#72
Exceptional
48.3%
Immigrants from Singapore
98.6
/100
|
#73
Exceptional
48.3%
Immigrants from Romania
98.6
/100
|
#74
Exceptional
48.3%
Immigrants from England
98.4
/100
|
#75
Exceptional
48.2%
Immigrants from Fiji
98.4
/100
|
#76
Exceptional
48.2%
Canadians
98.2
/100
|
#77
Exceptional
48.2%
Egyptians
98.2
/100
|
#78
Exceptional
48.2%
Immigrants from Netherlands
98.2
/100
|
#79
Exceptional
48.2%
Russians
98.1
/100
|
#80
Exceptional
48.2%
Finns
98.0
/100
|
#81
Exceptional
48.1%
Immigrants from Poland
97.7
/100
|
#82
Exceptional
48.1%
Guamanians/Chamorros
97.6
/100
|
#83
Exceptional
48.1%
Ukrainians
97.6
/100
|
#84
Exceptional
48.1%
Immigrants from Israel
97.4
/100
|
#85
Exceptional
48.0%
Belgians
97.4
/100
|
#86
Exceptional
48.0%

Immigrants from Netherlands Married-couple Households Correlation Summary

MeasurementImmigrants from Netherlands DataMarried-couple Households Data
Minimum0.037%29.2%
Maximum33.1%77.9%
Range33.1%48.7%
Mean5.1%52.3%
Median2.9%52.7%
Interquartile 25% (IQ1)1.4%44.4%
Interquartile 75% (IQ3)6.3%58.8%
Interquartile Range (IQR)4.9%14.4%
Standard Deviation (Sample)6.3%12.0%
Standard Deviation (Population)6.3%11.9%

Correlation Details

Immigrants from Netherlands PercentileSample SizeMarried-couple Households
[
0.0%
-
0.5%
]
0.037%
210,937,56345.0%
[
0.0%
-
0.5%
]
0.17%
18,877,17850.4%
[
0.0%
-
0.5%
]
0.29%
4,451,19452.3%
[
0.0%
-
0.5%
]
0.42%
1,583,20350.8%
[
0.5%
-
1.0%
]
0.54%
651,94053.7%
[
0.5%
-
1.0%
]
0.67%
371,91549.8%
[
0.5%
-
1.0%
]
0.79%
349,37954.3%
[
0.5%
-
1.0%
]
0.93%
99,89449.7%
[
1.0%
-
1.5%
]
1.05%
125,94560.0%
[
1.0%
-
1.5%
]
1.15%
71,93354.6%
[
1.0%
-
1.5%
]
1.29%
49,47943.7%
[
1.0%
-
1.5%
]
1.40%
55,91168.6%
[
1.0%
-
1.5%
]
1.49%
35,09356.0%
[
1.5%
-
2.0%
]
1.64%
15,95650.9%
[
1.5%
-
2.0%
]
1.74%
11,10153.0%
[
1.5%
-
2.0%
]
1.89%
6,02061.1%
[
1.5%
-
2.0%
]
2.00%
12,06438.6%
[
2.0%
-
2.5%
]
2.07%
25,11574.8%
[
2.0%
-
2.5%
]
2.24%
3,97649.3%
[
2.0%
-
2.5%
]
2.38%
15,14156.1%
[
2.0%
-
2.5%
]
2.45%
5,09747.0%
[
2.5%
-
3.0%
]
2.57%
7,47149.9%
[
2.5%
-
3.0%
]
2.72%
6,13360.4%
[
2.5%
-
3.0%
]
2.89%
2,52775.2%
[
2.5%
-
3.0%
]
2.97%
67376.8%
[
3.0%
-
3.5%
]
3.07%
5,36761.3%
[
3.0%
-
3.5%
]
3.30%
36441.3%
[
3.5%
-
4.0%
]
3.67%
40931.5%
[
3.5%
-
4.0%
]
3.78%
1,82649.9%
[
4.0%
-
4.5%
]
4.04%
4,16158.0%
[
4.0%
-
4.5%
]
4.39%
1,14064.9%
[
4.5%
-
5.0%
]
4.52%
66336.6%
[
4.5%
-
5.0%
]
4.68%
2,77867.7%
[
5.0%
-
5.5%
]
5.23%
1,77757.7%
[
5.5%
-
6.0%
]
5.53%
77831.2%
[
6.0%
-
6.5%
]
6.18%
1,35959.6%
[
6.5%
-
7.0%
]
6.50%
44629.2%
[
6.5%
-
7.0%
]
6.60%
80353.8%
[
7.0%
-
7.5%
]
7.30%
17843.6%
[
8.5%
-
9.0%
]
8.72%
96356.1%
[
8.5%
-
9.0%
]
8.79%
42135.1%
[
9.0%
-
9.5%
]
9.05%
43177.9%
[
10.5%
-
11.0%
]
10.77%
19531.0%
[
13.5%
-
14.0%
]
13.51%
7454.1%
[
15.0%
-
15.5%
]
15.04%
83841.1%
[
16.0%
-
16.5%
]
16.44%
22537.8%
[
24.0%
-
24.5%
]
24.27%
10356.2%
[
33.0%
-
33.5%
]
33.10%
14250.6%