Immigrants from Nepal Married-couple Households
COMPARE
Immigrants from Nepal
Select to Compare
Married-couple Households
Immigrants from Nepal Married-couple Households
45.2%
MARRIED-COUPLE HOUSEHOLDS
5.6/ 100
METRIC RATING
215th/ 347
METRIC RANK
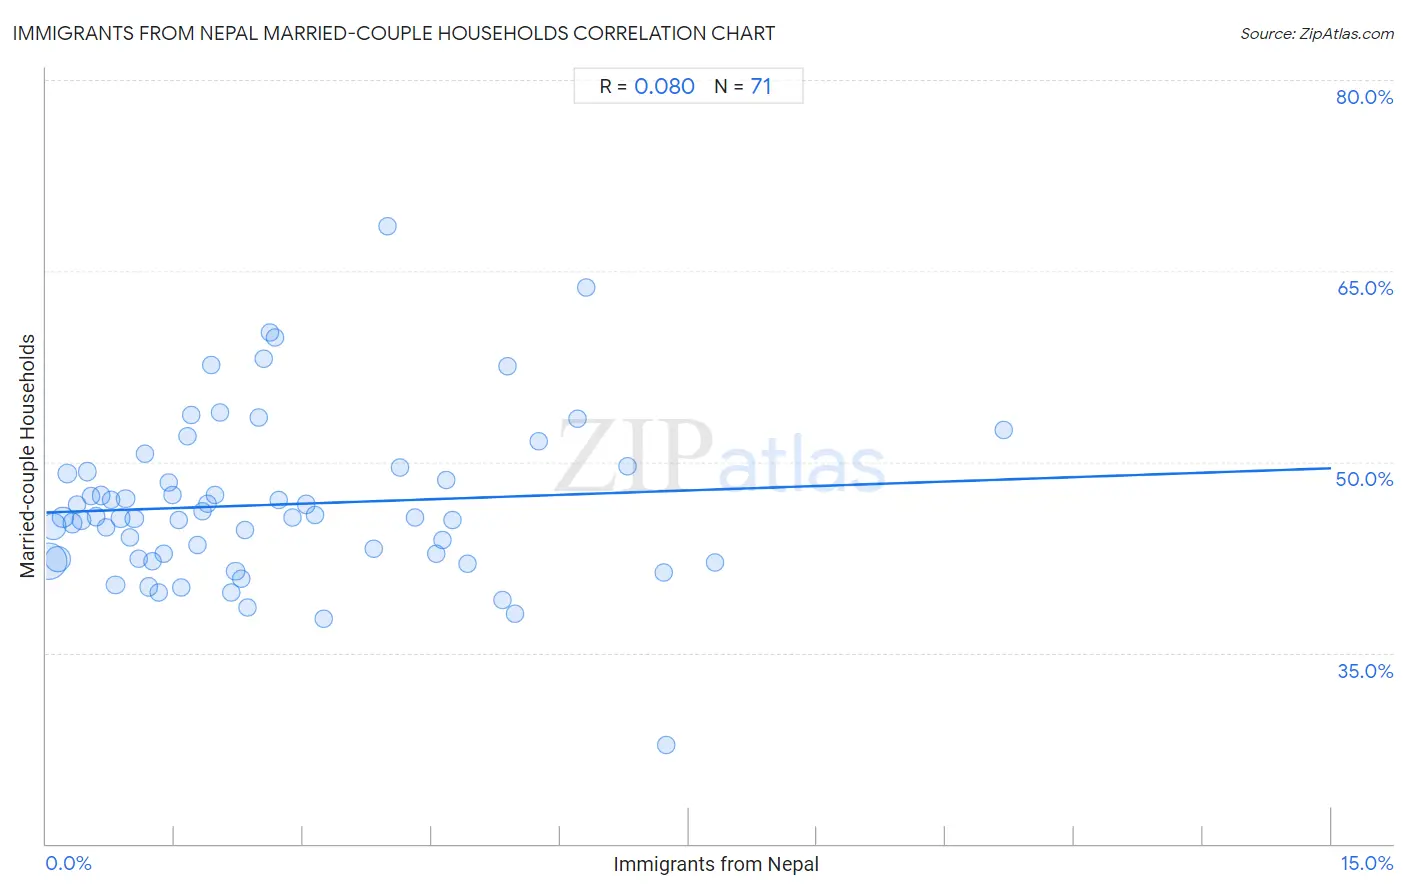
Immigrants from Nepal Married-couple Households Correlation Chart
The statistical analysis conducted on geographies consisting of 186,686,062 people shows a slight positive correlation between the proportion of Immigrants from Nepal and percentage of married-couple family households in the United States with a correlation coefficient (R) of 0.080 and weighted average of 45.2%. On average, for every 1% (one percent) increase in Immigrants from Nepal within a typical geography, there is an increase of 0.23% in percentage of married-couple family households.
It is essential to understand that the correlation between the percentage of Immigrants from Nepal and percentage of married-couple family households does not imply a direct cause-and-effect relationship. It remains uncertain whether the presence of Immigrants from Nepal influences an upward or downward trend in the level of percentage of married-couple family households within an area, or if Immigrants from Nepal simply ended up residing in those areas with higher or lower levels of percentage of married-couple family households due to other factors.
Demographics Similar to Immigrants from Nepal by Married-couple Households
In terms of married-couple households, the demographic groups most similar to Immigrants from Nepal are Immigrants from Portugal (45.2%, a difference of 0.0%), Japanese (45.2%, a difference of 0.020%), Panamanian (45.2%, a difference of 0.020%), Yakama (45.2%, a difference of 0.040%), and Immigrants from the Azores (45.2%, a difference of 0.050%).
| Demographics | Rating | Rank | Married-couple Households |
| Hispanics or Latinos | 8.7 /100 | #208 | Tragic 45.4% |
| Immigrants from Uzbekistan | 8.4 /100 | #209 | Tragic 45.4% |
| Cubans | 7.7 /100 | #210 | Tragic 45.4% |
| Immigrants from Spain | 7.3 /100 | #211 | Tragic 45.3% |
| Creek | 6.4 /100 | #212 | Tragic 45.3% |
| Yakama | 5.8 /100 | #213 | Tragic 45.2% |
| Japanese | 5.7 /100 | #214 | Tragic 45.2% |
| Immigrants from Nepal | 5.6 /100 | #215 | Tragic 45.2% |
| Immigrants from Portugal | 5.6 /100 | #216 | Tragic 45.2% |
| Panamanians | 5.5 /100 | #217 | Tragic 45.2% |
| Immigrants from the Azores | 5.3 /100 | #218 | Tragic 45.2% |
| Nicaraguans | 5.3 /100 | #219 | Tragic 45.2% |
| Immigrants from Thailand | 5.1 /100 | #220 | Tragic 45.2% |
| Tlingit-Haida | 4.9 /100 | #221 | Tragic 45.1% |
| Immigrants from Laos | 4.6 /100 | #222 | Tragic 45.1% |
Immigrants from Nepal Married-couple Households Correlation Summary
| Measurement | Immigrants from Nepal Data | Married-couple Households Data |
| Minimum | 0.026% | 27.8% |
| Maximum | 11.2% | 68.6% |
| Range | 11.2% | 40.8% |
| Mean | 2.7% | 46.6% |
| Median | 2.0% | 45.6% |
| Interquartile 25% (IQ1) | 0.98% | 42.3% |
| Interquartile 75% (IQ3) | 4.1% | 49.2% |
| Interquartile Range (IQR) | 3.2% | 6.9% |
| Standard Deviation (Sample) | 2.3% | 6.5% |
| Standard Deviation (Population) | 2.2% | 6.5% |
Correlation Details
| Immigrants from Nepal Percentile | Sample Size | Married-couple Households |
[ 0.0% - 0.5% ] 0.026% | 77,659,502 | 42.2% |
[ 0.0% - 0.5% ] 0.080% | 34,288,669 | 44.9% |
[ 0.0% - 0.5% ] 0.14% | 28,136,258 | 42.3% |
[ 0.0% - 0.5% ] 0.19% | 12,246,733 | 45.6% |
[ 0.0% - 0.5% ] 0.25% | 6,924,457 | 49.1% |
[ 0.0% - 0.5% ] 0.30% | 6,076,097 | 45.2% |
[ 0.0% - 0.5% ] 0.36% | 3,895,695 | 46.6% |
[ 0.0% - 0.5% ] 0.41% | 3,335,429 | 45.4% |
[ 0.0% - 0.5% ] 0.48% | 1,886,016 | 49.2% |
[ 0.5% - 1.0% ] 0.52% | 1,622,167 | 47.3% |
[ 0.5% - 1.0% ] 0.58% | 1,493,915 | 45.7% |
[ 0.5% - 1.0% ] 0.64% | 1,133,316 | 47.3% |
[ 0.5% - 1.0% ] 0.70% | 1,039,057 | 44.9% |
[ 0.5% - 1.0% ] 0.75% | 979,898 | 47.0% |
[ 0.5% - 1.0% ] 0.81% | 810,202 | 40.3% |
[ 0.5% - 1.0% ] 0.87% | 246,349 | 45.6% |
[ 0.5% - 1.0% ] 0.93% | 375,683 | 47.1% |
[ 0.5% - 1.0% ] 0.98% | 444,881 | 44.0% |
[ 1.0% - 1.5% ] 1.03% | 413,124 | 45.5% |
[ 1.0% - 1.5% ] 1.08% | 618,101 | 42.4% |
[ 1.0% - 1.5% ] 1.15% | 332,401 | 50.6% |
[ 1.0% - 1.5% ] 1.20% | 205,917 | 40.2% |
[ 1.0% - 1.5% ] 1.24% | 168,720 | 42.2% |
[ 1.0% - 1.5% ] 1.32% | 190,462 | 39.8% |
[ 1.0% - 1.5% ] 1.37% | 141,269 | 42.8% |
[ 1.0% - 1.5% ] 1.42% | 69,948 | 48.4% |
[ 1.0% - 1.5% ] 1.48% | 27,554 | 47.4% |
[ 1.5% - 2.0% ] 1.54% | 80,206 | 45.4% |
[ 1.5% - 2.0% ] 1.58% | 44,924 | 40.2% |
[ 1.5% - 2.0% ] 1.65% | 178,897 | 52.0% |
[ 1.5% - 2.0% ] 1.70% | 100,652 | 53.7% |
[ 1.5% - 2.0% ] 1.76% | 107,656 | 43.4% |
[ 1.5% - 2.0% ] 1.83% | 21,021 | 46.2% |
[ 1.5% - 2.0% ] 1.88% | 99,942 | 46.7% |
[ 1.5% - 2.0% ] 1.93% | 24,975 | 57.6% |
[ 1.5% - 2.0% ] 1.96% | 358,784 | 47.4% |
[ 2.0% - 2.5% ] 2.04% | 4,471 | 53.9% |
[ 2.0% - 2.5% ] 2.16% | 54,548 | 39.7% |
[ 2.0% - 2.5% ] 2.21% | 109,029 | 41.4% |
[ 2.0% - 2.5% ] 2.28% | 26,531 | 40.8% |
[ 2.0% - 2.5% ] 2.32% | 28,055 | 44.6% |
[ 2.0% - 2.5% ] 2.35% | 43,568 | 38.6% |
[ 2.0% - 2.5% ] 2.48% | 14,052 | 53.5% |
[ 2.5% - 3.0% ] 2.54% | 54,526 | 58.1% |
[ 2.5% - 3.0% ] 2.61% | 8,194 | 60.1% |
[ 2.5% - 3.0% ] 2.66% | 54,628 | 59.8% |
[ 2.5% - 3.0% ] 2.72% | 112,629 | 47.0% |
[ 2.5% - 3.0% ] 2.87% | 17,107 | 45.6% |
[ 3.0% - 3.5% ] 3.04% | 115,734 | 46.7% |
[ 3.0% - 3.5% ] 3.13% | 38,632 | 45.9% |
[ 3.0% - 3.5% ] 3.24% | 11,364 | 37.6% |
[ 3.5% - 4.0% ] 3.82% | 30,708 | 43.1% |
[ 3.5% - 4.0% ] 3.98% | 1,458 | 68.6% |
[ 4.0% - 4.5% ] 4.13% | 20,720 | 49.6% |
[ 4.0% - 4.5% ] 4.30% | 26,684 | 45.6% |
[ 4.5% - 5.0% ] 4.55% | 3,582 | 42.7% |
[ 4.5% - 5.0% ] 4.62% | 6,861 | 43.9% |
[ 4.5% - 5.0% ] 4.67% | 31,963 | 48.6% |
[ 4.5% - 5.0% ] 4.75% | 14,553 | 45.5% |
[ 4.5% - 5.0% ] 4.92% | 2,945 | 42.0% |
[ 5.0% - 5.5% ] 5.32% | 1,936 | 39.1% |
[ 5.0% - 5.5% ] 5.39% | 946 | 57.5% |
[ 5.0% - 5.5% ] 5.48% | 1,132 | 38.0% |
[ 5.5% - 6.0% ] 5.75% | 6,571 | 51.7% |
[ 6.0% - 6.5% ] 6.19% | 339 | 53.4% |
[ 6.0% - 6.5% ] 6.30% | 3,190 | 63.7% |
[ 6.5% - 7.0% ] 6.78% | 1,651 | 49.6% |
[ 7.0% - 7.5% ] 7.21% | 971 | 41.3% |
[ 7.0% - 7.5% ] 7.24% | 24,892 | 27.8% |
[ 7.5% - 8.0% ] 7.81% | 32,559 | 42.1% |
[ 11.0% - 11.5% ] 11.18% | 456 | 52.5% |