Immigrants from Nepal Wage/Income Gap
COMPARE
Immigrants from Nepal
Select to Compare
Wage/Income Gap
Immigrants from Nepal Wage/Income Gap
24.9%
WAGE/INCOME GAP
89.3/ 100
METRIC RATING
140th/ 347
METRIC RANK
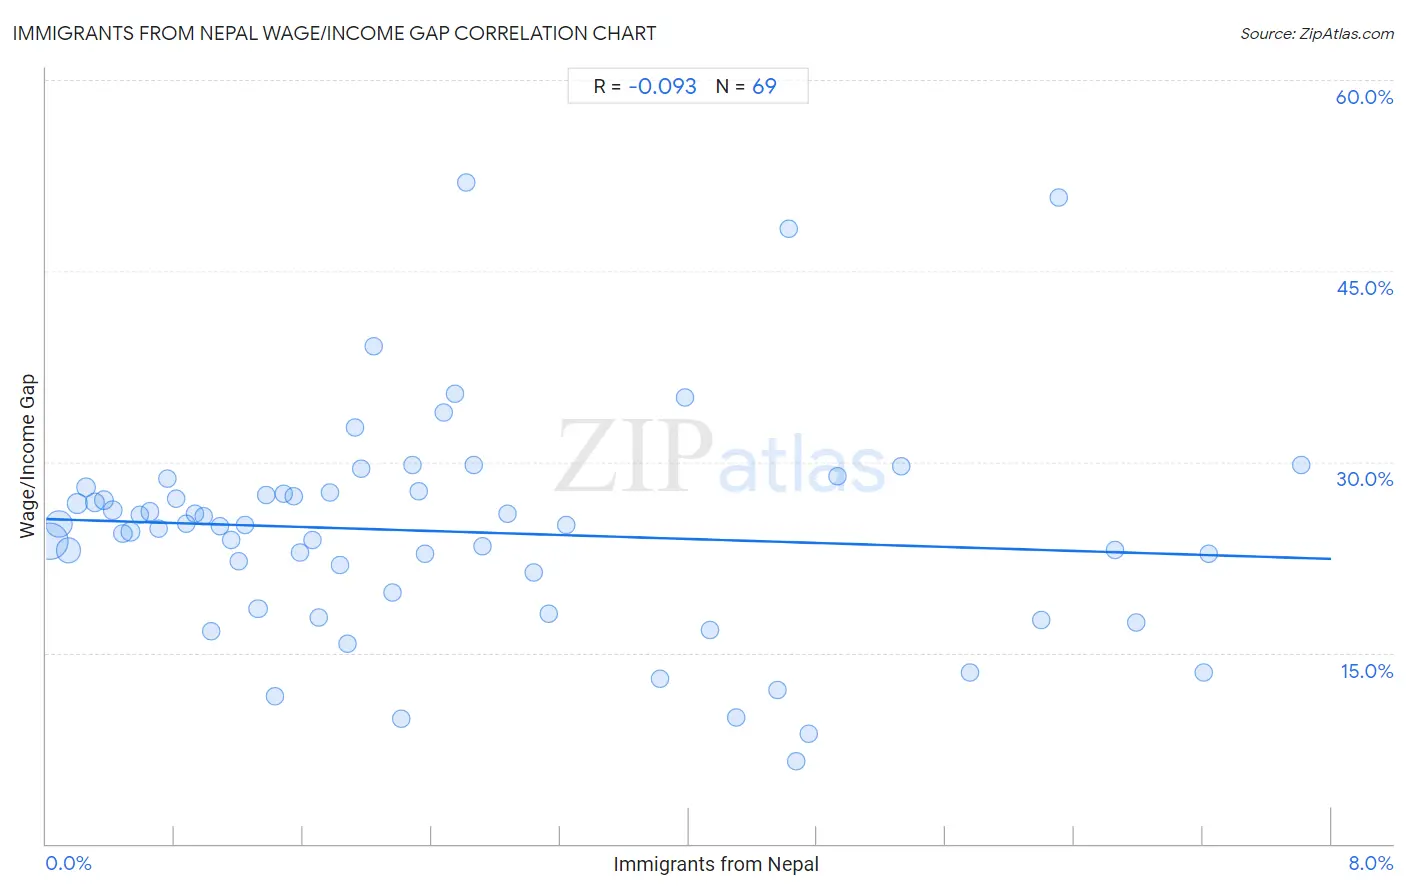
Immigrants from Nepal Wage/Income Gap Correlation Chart
The statistical analysis conducted on geographies consisting of 186,773,230 people shows a slight negative correlation between the proportion of Immigrants from Nepal and wage/income gap percentage in the United States with a correlation coefficient (R) of -0.093 and weighted average of 24.9%. On average, for every 1% (one percent) increase in Immigrants from Nepal within a typical geography, there is a decrease of 0.39% in wage/income gap percentage.
It is essential to understand that the correlation between the percentage of Immigrants from Nepal and wage/income gap percentage does not imply a direct cause-and-effect relationship. It remains uncertain whether the presence of Immigrants from Nepal influences an upward or downward trend in the level of wage/income gap percentage within an area, or if Immigrants from Nepal simply ended up residing in those areas with higher or lower levels of wage/income gap percentage due to other factors.
Demographics Similar to Immigrants from Nepal by Wage/Income Gap
In terms of wage/income gap, the demographic groups most similar to Immigrants from Nepal are Hawaiian (24.9%, a difference of 0.010%), Hispanic or Latino (24.9%, a difference of 0.030%), Immigrants from Bosnia and Herzegovina (24.8%, a difference of 0.14%), Afghan (24.9%, a difference of 0.21%), and Immigrants from Uganda (24.9%, a difference of 0.22%).
| Demographics | Rating | Rank | Wage/Income Gap |
| Colombians | 92.4 /100 | #133 | Exceptional 24.7% |
| Mexican American Indians | 92.2 /100 | #134 | Exceptional 24.7% |
| South American Indians | 92.0 /100 | #135 | Exceptional 24.7% |
| Armenians | 91.3 /100 | #136 | Exceptional 24.8% |
| Immigrants from South Eastern Asia | 90.9 /100 | #137 | Exceptional 24.8% |
| Immigrants from Bosnia and Herzegovina | 90.1 /100 | #138 | Exceptional 24.8% |
| Hispanics or Latinos | 89.5 /100 | #139 | Excellent 24.9% |
| Immigrants from Nepal | 89.3 /100 | #140 | Excellent 24.9% |
| Hawaiians | 89.3 /100 | #141 | Excellent 24.9% |
| Afghans | 88.1 /100 | #142 | Excellent 24.9% |
| Immigrants from Uganda | 88.0 /100 | #143 | Excellent 24.9% |
| Chippewa | 86.9 /100 | #144 | Excellent 25.0% |
| Comanche | 85.2 /100 | #145 | Excellent 25.0% |
| South Americans | 85.2 /100 | #146 | Excellent 25.0% |
| Malaysians | 84.9 /100 | #147 | Excellent 25.0% |
Immigrants from Nepal Wage/Income Gap Correlation Summary
| Measurement | Immigrants from Nepal Data | Wage/Income Gap Data |
| Minimum | 0.026% | 6.5% |
| Maximum | 7.8% | 52.0% |
| Range | 7.8% | 45.5% |
| Mean | 2.5% | 24.5% |
| Median | 1.9% | 25.0% |
| Interquartile 25% (IQ1) | 0.95% | 19.1% |
| Interquartile 75% (IQ3) | 3.9% | 27.6% |
| Interquartile Range (IQR) | 2.9% | 8.5% |
| Standard Deviation (Sample) | 2.0% | 8.6% |
| Standard Deviation (Population) | 2.0% | 8.6% |
Correlation Details
| Immigrants from Nepal Percentile | Sample Size | Wage/Income Gap |
[ 0.0% - 0.5% ] 0.026% | 77,665,403 | 23.8% |
[ 0.0% - 0.5% ] 0.080% | 34,303,441 | 25.1% |
[ 0.0% - 0.5% ] 0.14% | 28,171,873 | 23.0% |
[ 0.0% - 0.5% ] 0.19% | 12,256,393 | 26.7% |
[ 0.0% - 0.5% ] 0.25% | 6,931,257 | 28.0% |
[ 0.0% - 0.5% ] 0.30% | 6,081,460 | 26.8% |
[ 0.0% - 0.5% ] 0.36% | 3,895,695 | 27.0% |
[ 0.0% - 0.5% ] 0.41% | 3,334,712 | 26.2% |
[ 0.0% - 0.5% ] 0.48% | 1,886,016 | 24.3% |
[ 0.5% - 1.0% ] 0.52% | 1,622,167 | 24.5% |
[ 0.5% - 1.0% ] 0.58% | 1,494,963 | 25.8% |
[ 0.5% - 1.0% ] 0.64% | 1,133,316 | 26.1% |
[ 0.5% - 1.0% ] 0.70% | 1,042,582 | 24.7% |
[ 0.5% - 1.0% ] 0.75% | 979,898 | 28.7% |
[ 0.5% - 1.0% ] 0.81% | 804,517 | 27.1% |
[ 0.5% - 1.0% ] 0.87% | 246,936 | 25.2% |
[ 0.5% - 1.0% ] 0.93% | 375,683 | 25.9% |
[ 0.5% - 1.0% ] 0.98% | 448,162 | 25.8% |
[ 1.0% - 1.5% ] 1.03% | 413,124 | 16.7% |
[ 1.0% - 1.5% ] 1.08% | 622,579 | 25.0% |
[ 1.0% - 1.5% ] 1.15% | 332,401 | 23.9% |
[ 1.0% - 1.5% ] 1.20% | 204,060 | 22.2% |
[ 1.0% - 1.5% ] 1.24% | 168,720 | 25.0% |
[ 1.0% - 1.5% ] 1.32% | 191,518 | 18.4% |
[ 1.0% - 1.5% ] 1.37% | 142,920 | 27.4% |
[ 1.0% - 1.5% ] 1.42% | 68,691 | 11.6% |
[ 1.0% - 1.5% ] 1.48% | 25,654 | 27.5% |
[ 1.5% - 2.0% ] 1.54% | 79,154 | 27.3% |
[ 1.5% - 2.0% ] 1.58% | 46,945 | 22.9% |
[ 1.5% - 2.0% ] 1.65% | 178,897 | 23.8% |
[ 1.5% - 2.0% ] 1.70% | 100,652 | 17.8% |
[ 1.5% - 2.0% ] 1.76% | 106,972 | 27.6% |
[ 1.5% - 2.0% ] 1.83% | 21,021 | 21.9% |
[ 1.5% - 2.0% ] 1.88% | 99,673 | 15.7% |
[ 1.5% - 2.0% ] 1.93% | 24,975 | 32.7% |
[ 1.5% - 2.0% ] 1.96% | 356,781 | 29.4% |
[ 2.0% - 2.5% ] 2.04% | 4,471 | 39.1% |
[ 2.0% - 2.5% ] 2.16% | 54,548 | 19.7% |
[ 2.0% - 2.5% ] 2.21% | 109,029 | 9.8% |
[ 2.0% - 2.5% ] 2.28% | 26,531 | 29.7% |
[ 2.0% - 2.5% ] 2.32% | 28,055 | 27.7% |
[ 2.0% - 2.5% ] 2.35% | 43,568 | 22.7% |
[ 2.0% - 2.5% ] 2.48% | 14,052 | 33.9% |
[ 2.5% - 3.0% ] 2.54% | 55,349 | 35.3% |
[ 2.5% - 3.0% ] 2.61% | 8,194 | 52.0% |
[ 2.5% - 3.0% ] 2.66% | 54,628 | 29.7% |
[ 2.5% - 3.0% ] 2.72% | 112,629 | 23.4% |
[ 2.5% - 3.0% ] 2.87% | 17,107 | 25.9% |
[ 3.0% - 3.5% ] 3.04% | 117,137 | 21.3% |
[ 3.0% - 3.5% ] 3.13% | 38,632 | 18.0% |
[ 3.0% - 3.5% ] 3.24% | 11,364 | 25.0% |
[ 3.5% - 4.0% ] 3.82% | 32,951 | 13.0% |
[ 3.5% - 4.0% ] 3.98% | 1,458 | 35.1% |
[ 4.0% - 4.5% ] 4.13% | 20,720 | 16.8% |
[ 4.0% - 4.5% ] 4.30% | 26,684 | 9.9% |
[ 4.5% - 5.0% ] 4.55% | 3,582 | 12.1% |
[ 4.5% - 5.0% ] 4.62% | 6,861 | 48.3% |
[ 4.5% - 5.0% ] 4.67% | 31,963 | 6.5% |
[ 4.5% - 5.0% ] 4.75% | 14,553 | 8.7% |
[ 4.5% - 5.0% ] 4.92% | 2,945 | 28.9% |
[ 5.0% - 5.5% ] 5.32% | 1,936 | 29.6% |
[ 5.5% - 6.0% ] 5.75% | 6,571 | 13.5% |
[ 6.0% - 6.5% ] 6.19% | 339 | 17.6% |
[ 6.0% - 6.5% ] 6.30% | 3,190 | 50.8% |
[ 6.5% - 7.0% ] 6.65% | 4,899 | 23.1% |
[ 6.5% - 7.0% ] 6.78% | 1,651 | 17.4% |
[ 7.0% - 7.5% ] 7.21% | 971 | 13.5% |
[ 7.0% - 7.5% ] 7.24% | 24,892 | 22.7% |
[ 7.5% - 8.0% ] 7.81% | 32,559 | 29.8% |