Immigrants from Nepal 2 or more Vehicles in Household
COMPARE
Immigrants from Nepal
Select to Compare
2 or more Vehicles in Household
Immigrants from Nepal 2 or more Vehicles in Household
53.5%
2+ VEHICLES AVAILABLE
3.6/ 100
METRIC RATING
230th/ 347
METRIC RANK
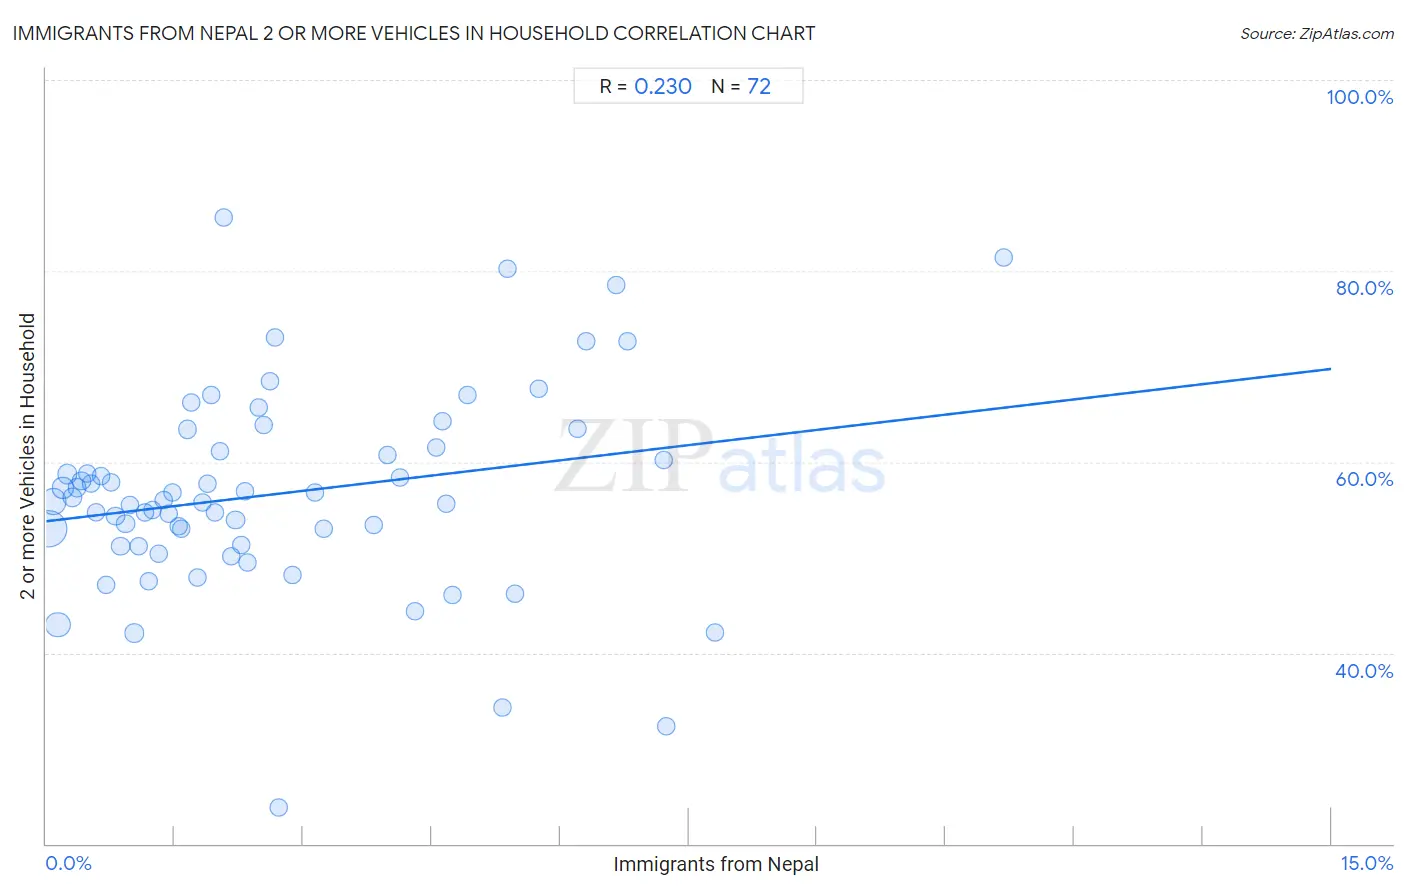
Immigrants from Nepal 2 or more Vehicles in Household Correlation Chart
The statistical analysis conducted on geographies consisting of 186,595,631 people shows a weak positive correlation between the proportion of Immigrants from Nepal and percentage of households with 2 or more vehicles available in the United States with a correlation coefficient (R) of 0.230 and weighted average of 53.5%. On average, for every 1% (one percent) increase in Immigrants from Nepal within a typical geography, there is an increase of 1.1% in percentage of households with 2 or more vehicles available.
It is essential to understand that the correlation between the percentage of Immigrants from Nepal and percentage of households with 2 or more vehicles available does not imply a direct cause-and-effect relationship. It remains uncertain whether the presence of Immigrants from Nepal influences an upward or downward trend in the level of percentage of households with 2 or more vehicles available within an area, or if Immigrants from Nepal simply ended up residing in those areas with higher or lower levels of percentage of households with 2 or more vehicles available due to other factors.
Demographics Similar to Immigrants from Nepal by 2 or more Vehicles in Household
In terms of 2 or more vehicles in household, the demographic groups most similar to Immigrants from Nepal are Panamanian (53.5%, a difference of 0.050%), Immigrants from Turkey (53.6%, a difference of 0.060%), Alaska Native (53.6%, a difference of 0.080%), Immigrants from Guatemala (53.5%, a difference of 0.12%), and Ugandan (53.5%, a difference of 0.13%).
| Demographics | Rating | Rank | 2 or more Vehicles in Household |
| Immigrants from Bosnia and Herzegovina | 5.5 /100 | #223 | Tragic 53.8% |
| Brazilians | 5.3 /100 | #224 | Tragic 53.8% |
| Immigrants from Egypt | 5.2 /100 | #225 | Tragic 53.8% |
| Immigrants from Eastern Africa | 5.1 /100 | #226 | Tragic 53.7% |
| Sudanese | 4.1 /100 | #227 | Tragic 53.6% |
| Alaska Natives | 3.9 /100 | #228 | Tragic 53.6% |
| Immigrants from Turkey | 3.8 /100 | #229 | Tragic 53.6% |
| Immigrants from Nepal | 3.6 /100 | #230 | Tragic 53.5% |
| Panamanians | 3.4 /100 | #231 | Tragic 53.5% |
| Immigrants from Guatemala | 3.2 /100 | #232 | Tragic 53.5% |
| Ugandans | 3.2 /100 | #233 | Tragic 53.5% |
| Immigrants from Switzerland | 3.0 /100 | #234 | Tragic 53.4% |
| Immigrants from Middle Africa | 3.0 /100 | #235 | Tragic 53.4% |
| Indonesians | 2.7 /100 | #236 | Tragic 53.4% |
| Macedonians | 2.4 /100 | #237 | Tragic 53.3% |
Immigrants from Nepal 2 or more Vehicles in Household Correlation Summary
| Measurement | Immigrants from Nepal Data | 2 or more Vehicles in Household Data |
| Minimum | 0.026% | 23.8% |
| Maximum | 11.2% | 85.6% |
| Range | 11.2% | 61.8% |
| Mean | 2.7% | 56.7% |
| Median | 2.0% | 55.9% |
| Interquartile 25% (IQ1) | 1.0% | 51.2% |
| Interquartile 75% (IQ3) | 4.2% | 61.3% |
| Interquartile Range (IQR) | 3.2% | 10.1% |
| Standard Deviation (Sample) | 2.3% | 10.6% |
| Standard Deviation (Population) | 2.3% | 10.5% |
Correlation Details
| Immigrants from Nepal Percentile | Sample Size | 2 or more Vehicles in Household |
[ 0.0% - 0.5% ] 0.026% | 77,665,403 | 53.0% |
[ 0.0% - 0.5% ] 0.080% | 34,298,632 | 55.9% |
[ 0.0% - 0.5% ] 0.14% | 28,140,557 | 42.9% |
[ 0.0% - 0.5% ] 0.19% | 12,246,733 | 57.3% |
[ 0.0% - 0.5% ] 0.25% | 6,924,457 | 58.7% |
[ 0.0% - 0.5% ] 0.30% | 6,076,097 | 56.3% |
[ 0.0% - 0.5% ] 0.36% | 3,895,695 | 57.3% |
[ 0.0% - 0.5% ] 0.41% | 3,335,429 | 58.0% |
[ 0.0% - 0.5% ] 0.48% | 1,886,016 | 58.8% |
[ 0.5% - 1.0% ] 0.52% | 1,622,167 | 57.8% |
[ 0.5% - 1.0% ] 0.58% | 1,493,915 | 54.7% |
[ 0.5% - 1.0% ] 0.64% | 1,133,316 | 58.5% |
[ 0.5% - 1.0% ] 0.70% | 1,039,057 | 47.1% |
[ 0.5% - 1.0% ] 0.75% | 979,898 | 57.8% |
[ 0.5% - 1.0% ] 0.81% | 810,202 | 54.3% |
[ 0.5% - 1.0% ] 0.87% | 246,349 | 51.2% |
[ 0.5% - 1.0% ] 0.93% | 375,683 | 53.6% |
[ 0.5% - 1.0% ] 0.98% | 444,881 | 55.5% |
[ 1.0% - 1.5% ] 1.03% | 413,124 | 42.1% |
[ 1.0% - 1.5% ] 1.08% | 618,101 | 51.1% |
[ 1.0% - 1.5% ] 1.15% | 332,401 | 54.7% |
[ 1.0% - 1.5% ] 1.20% | 205,917 | 47.5% |
[ 1.0% - 1.5% ] 1.24% | 168,720 | 55.0% |
[ 1.0% - 1.5% ] 1.32% | 190,462 | 50.4% |
[ 1.0% - 1.5% ] 1.37% | 141,269 | 56.0% |
[ 1.0% - 1.5% ] 1.42% | 69,948 | 54.6% |
[ 1.0% - 1.5% ] 1.48% | 27,554 | 56.8% |
[ 1.5% - 2.0% ] 1.54% | 80,206 | 53.3% |
[ 1.5% - 2.0% ] 1.58% | 44,924 | 53.0% |
[ 1.5% - 2.0% ] 1.65% | 178,897 | 63.4% |
[ 1.5% - 2.0% ] 1.70% | 100,652 | 66.2% |
[ 1.5% - 2.0% ] 1.76% | 107,656 | 47.9% |
[ 1.5% - 2.0% ] 1.83% | 21,021 | 55.7% |
[ 1.5% - 2.0% ] 1.88% | 99,942 | 57.7% |
[ 1.5% - 2.0% ] 1.93% | 24,975 | 67.0% |
[ 1.5% - 2.0% ] 1.96% | 358,784 | 54.7% |
[ 2.0% - 2.5% ] 2.04% | 4,471 | 61.1% |
[ 2.0% - 2.5% ] 2.07% | 241 | 85.6% |
[ 2.0% - 2.5% ] 2.16% | 54,548 | 50.2% |
[ 2.0% - 2.5% ] 2.21% | 109,029 | 53.9% |
[ 2.0% - 2.5% ] 2.28% | 26,531 | 51.3% |
[ 2.0% - 2.5% ] 2.32% | 28,055 | 57.0% |
[ 2.0% - 2.5% ] 2.35% | 43,568 | 49.5% |
[ 2.0% - 2.5% ] 2.48% | 14,052 | 65.7% |
[ 2.5% - 3.0% ] 2.54% | 54,526 | 63.9% |
[ 2.5% - 3.0% ] 2.61% | 8,194 | 68.4% |
[ 2.5% - 3.0% ] 2.66% | 54,628 | 73.0% |
[ 2.5% - 3.0% ] 2.72% | 112,629 | 23.8% |
[ 2.5% - 3.0% ] 2.87% | 17,107 | 48.2% |
[ 3.0% - 3.5% ] 3.13% | 38,632 | 56.8% |
[ 3.0% - 3.5% ] 3.24% | 11,364 | 53.0% |
[ 3.5% - 4.0% ] 3.82% | 30,708 | 53.4% |
[ 3.5% - 4.0% ] 3.98% | 1,458 | 60.7% |
[ 4.0% - 4.5% ] 4.13% | 20,720 | 58.4% |
[ 4.0% - 4.5% ] 4.30% | 26,684 | 44.4% |
[ 4.5% - 5.0% ] 4.55% | 3,582 | 61.5% |
[ 4.5% - 5.0% ] 4.62% | 6,861 | 64.2% |
[ 4.5% - 5.0% ] 4.67% | 31,963 | 55.6% |
[ 4.5% - 5.0% ] 4.75% | 14,553 | 46.1% |
[ 4.5% - 5.0% ] 4.92% | 2,945 | 67.0% |
[ 5.0% - 5.5% ] 5.32% | 1,936 | 34.3% |
[ 5.0% - 5.5% ] 5.39% | 946 | 80.2% |
[ 5.0% - 5.5% ] 5.48% | 1,132 | 46.2% |
[ 5.5% - 6.0% ] 5.75% | 6,571 | 67.7% |
[ 6.0% - 6.5% ] 6.19% | 339 | 63.5% |
[ 6.0% - 6.5% ] 6.30% | 3,190 | 72.7% |
[ 6.5% - 7.0% ] 6.65% | 4,899 | 78.6% |
[ 6.5% - 7.0% ] 6.78% | 1,651 | 72.7% |
[ 7.0% - 7.5% ] 7.21% | 971 | 60.2% |
[ 7.0% - 7.5% ] 7.24% | 24,892 | 32.3% |
[ 7.5% - 8.0% ] 7.81% | 32,559 | 42.1% |
[ 11.0% - 11.5% ] 11.18% | 456 | 81.4% |