Immigrants from Nepal 4 or more Vehicles in Household
COMPARE
Immigrants from Nepal
Select to Compare
4 or more Vehicles in Household
Immigrants from Nepal 4 or more Vehicles in Household
5.6%
4+ VEHICLES AVAILABLE
0.9/ 100
METRIC RATING
266th/ 347
METRIC RANK
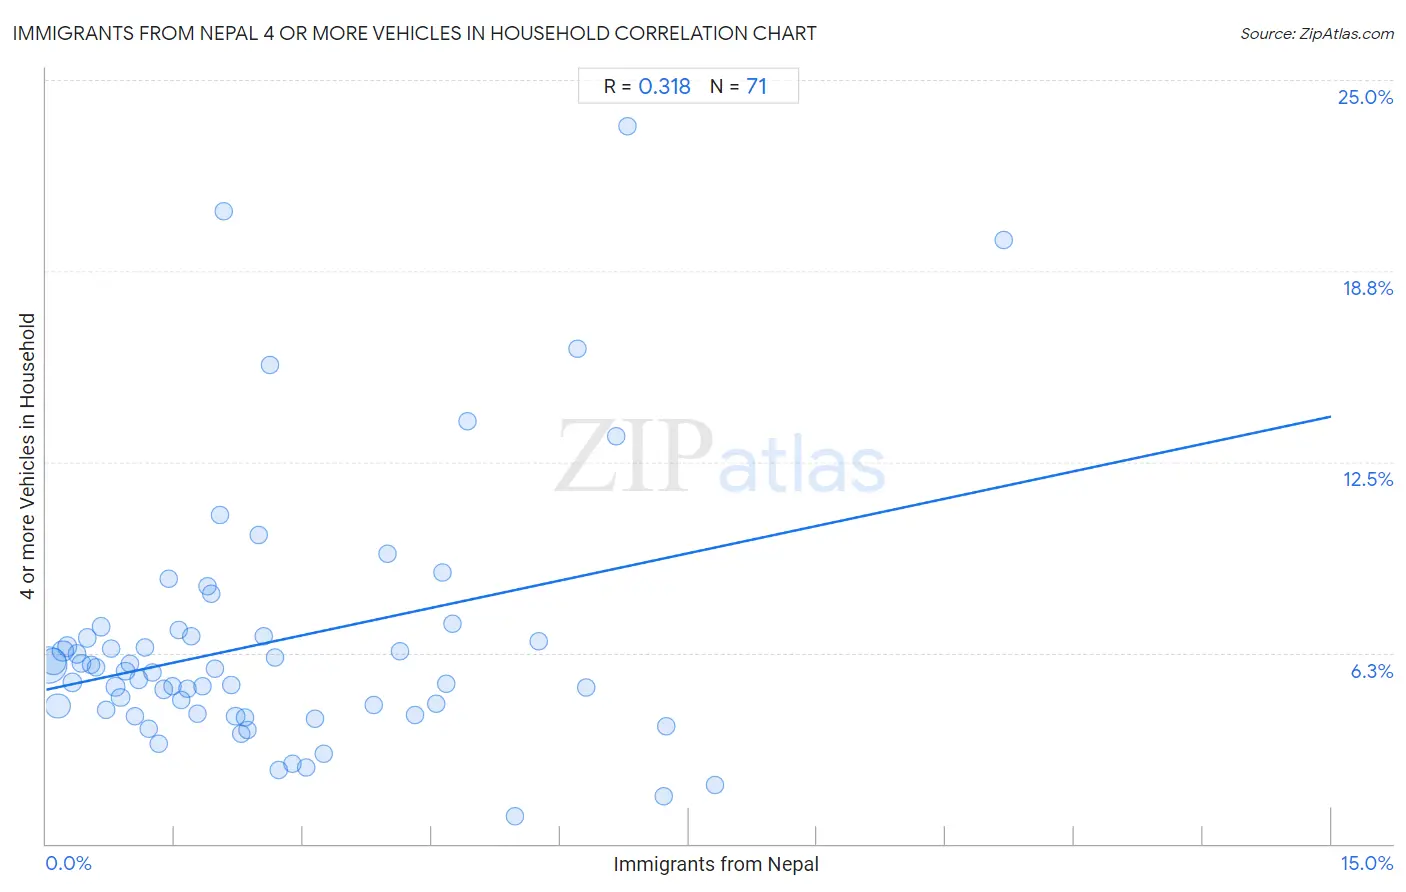
Immigrants from Nepal 4 or more Vehicles in Household Correlation Chart
The statistical analysis conducted on geographies consisting of 186,146,815 people shows a mild positive correlation between the proportion of Immigrants from Nepal and percentage of households with 4 or more vehicles available in the United States with a correlation coefficient (R) of 0.318 and weighted average of 5.6%. On average, for every 1% (one percent) increase in Immigrants from Nepal within a typical geography, there is an increase of 0.60% in percentage of households with 4 or more vehicles available.
It is essential to understand that the correlation between the percentage of Immigrants from Nepal and percentage of households with 4 or more vehicles available does not imply a direct cause-and-effect relationship. It remains uncertain whether the presence of Immigrants from Nepal influences an upward or downward trend in the level of percentage of households with 4 or more vehicles available within an area, or if Immigrants from Nepal simply ended up residing in those areas with higher or lower levels of percentage of households with 4 or more vehicles available due to other factors.
Demographics Similar to Immigrants from Nepal by 4 or more Vehicles in Household
In terms of 4 or more vehicles in household, the demographic groups most similar to Immigrants from Nepal are South American (5.6%, a difference of 0.020%), Immigrants from Ukraine (5.6%, a difference of 0.080%), Immigrants from Africa (5.6%, a difference of 0.24%), Colombian (5.5%, a difference of 0.51%), and Carpatho Rusyn (5.5%, a difference of 0.67%).
| Demographics | Rating | Rank | 4 or more Vehicles in Household |
| Immigrants from France | 1.3 /100 | #259 | Tragic 5.6% |
| Uruguayans | 1.3 /100 | #260 | Tragic 5.6% |
| Sudanese | 1.2 /100 | #261 | Tragic 5.6% |
| Bermudans | 1.2 /100 | #262 | Tragic 5.6% |
| Immigrants from Saudi Arabia | 1.1 /100 | #263 | Tragic 5.6% |
| Immigrants from Africa | 1.0 /100 | #264 | Tragic 5.6% |
| South Americans | 0.9 /100 | #265 | Tragic 5.6% |
| Immigrants from Nepal | 0.9 /100 | #266 | Tragic 5.6% |
| Immigrants from Ukraine | 0.9 /100 | #267 | Tragic 5.6% |
| Colombians | 0.7 /100 | #268 | Tragic 5.5% |
| Carpatho Rusyns | 0.7 /100 | #269 | Tragic 5.5% |
| Okinawans | 0.6 /100 | #270 | Tragic 5.5% |
| Immigrants from Sudan | 0.6 /100 | #271 | Tragic 5.5% |
| Immigrants from Kazakhstan | 0.6 /100 | #272 | Tragic 5.5% |
| Macedonians | 0.6 /100 | #273 | Tragic 5.5% |
Immigrants from Nepal 4 or more Vehicles in Household Correlation Summary
| Measurement | Immigrants from Nepal Data | 4 or more Vehicles in Household Data |
| Minimum | 0.026% | 0.91% |
| Maximum | 11.2% | 23.5% |
| Range | 11.2% | 22.6% |
| Mean | 2.6% | 6.6% |
| Median | 2.0% | 5.7% |
| Interquartile 25% (IQ1) | 0.98% | 4.2% |
| Interquartile 75% (IQ3) | 4.0% | 6.8% |
| Interquartile Range (IQR) | 3.0% | 2.6% |
| Standard Deviation (Sample) | 2.3% | 4.2% |
| Standard Deviation (Population) | 2.2% | 4.2% |
Correlation Details
| Immigrants from Nepal Percentile | Sample Size | 4 or more Vehicles in Household |
[ 0.0% - 0.5% ] 0.026% | 77,465,342 | 5.8% |
[ 0.0% - 0.5% ] 0.080% | 34,213,381 | 6.0% |
[ 0.0% - 0.5% ] 0.14% | 28,043,973 | 4.5% |
[ 0.0% - 0.5% ] 0.19% | 12,194,862 | 6.3% |
[ 0.0% - 0.5% ] 0.25% | 6,893,490 | 6.4% |
[ 0.0% - 0.5% ] 0.30% | 6,076,097 | 5.3% |
[ 0.0% - 0.5% ] 0.36% | 3,895,695 | 6.2% |
[ 0.0% - 0.5% ] 0.41% | 3,318,356 | 5.9% |
[ 0.0% - 0.5% ] 0.48% | 1,886,016 | 6.7% |
[ 0.5% - 1.0% ] 0.52% | 1,606,232 | 5.8% |
[ 0.5% - 1.0% ] 0.58% | 1,493,915 | 5.8% |
[ 0.5% - 1.0% ] 0.64% | 1,130,912 | 7.1% |
[ 0.5% - 1.0% ] 0.70% | 1,039,057 | 4.4% |
[ 0.5% - 1.0% ] 0.75% | 979,898 | 6.4% |
[ 0.5% - 1.0% ] 0.81% | 810,202 | 5.1% |
[ 0.5% - 1.0% ] 0.87% | 246,349 | 4.8% |
[ 0.5% - 1.0% ] 0.93% | 363,837 | 5.7% |
[ 0.5% - 1.0% ] 0.98% | 444,881 | 5.9% |
[ 1.0% - 1.5% ] 1.03% | 386,185 | 4.2% |
[ 1.0% - 1.5% ] 1.08% | 618,101 | 5.4% |
[ 1.0% - 1.5% ] 1.15% | 332,401 | 6.4% |
[ 1.0% - 1.5% ] 1.20% | 204,319 | 3.8% |
[ 1.0% - 1.5% ] 1.24% | 168,720 | 5.6% |
[ 1.0% - 1.5% ] 1.32% | 190,462 | 3.3% |
[ 1.0% - 1.5% ] 1.37% | 141,269 | 5.1% |
[ 1.0% - 1.5% ] 1.42% | 66,131 | 8.7% |
[ 1.0% - 1.5% ] 1.48% | 27,554 | 5.2% |
[ 1.5% - 2.0% ] 1.54% | 71,612 | 7.0% |
[ 1.5% - 2.0% ] 1.58% | 44,924 | 4.7% |
[ 1.5% - 2.0% ] 1.65% | 178,897 | 5.1% |
[ 1.5% - 2.0% ] 1.70% | 100,652 | 6.8% |
[ 1.5% - 2.0% ] 1.76% | 107,656 | 4.2% |
[ 1.5% - 2.0% ] 1.83% | 21,021 | 5.2% |
[ 1.5% - 2.0% ] 1.88% | 99,942 | 8.4% |
[ 1.5% - 2.0% ] 1.93% | 24,975 | 8.2% |
[ 1.5% - 2.0% ] 1.96% | 358,784 | 5.7% |
[ 2.0% - 2.5% ] 2.04% | 4,471 | 10.7% |
[ 2.0% - 2.5% ] 2.07% | 241 | 20.7% |
[ 2.0% - 2.5% ] 2.15% | 45,820 | 5.2% |
[ 2.0% - 2.5% ] 2.21% | 109,029 | 4.2% |
[ 2.0% - 2.5% ] 2.28% | 26,531 | 3.6% |
[ 2.0% - 2.5% ] 2.32% | 28,055 | 4.2% |
[ 2.0% - 2.5% ] 2.35% | 43,568 | 3.7% |
[ 2.0% - 2.5% ] 2.48% | 14,052 | 10.1% |
[ 2.5% - 3.0% ] 2.54% | 54,526 | 6.8% |
[ 2.5% - 3.0% ] 2.61% | 8,194 | 15.7% |
[ 2.5% - 3.0% ] 2.66% | 54,628 | 6.1% |
[ 2.5% - 3.0% ] 2.72% | 112,629 | 2.4% |
[ 2.5% - 3.0% ] 2.87% | 17,107 | 2.6% |
[ 3.0% - 3.5% ] 3.04% | 115,734 | 2.5% |
[ 3.0% - 3.5% ] 3.13% | 38,632 | 4.1% |
[ 3.0% - 3.5% ] 3.24% | 11,364 | 2.9% |
[ 3.5% - 4.0% ] 3.82% | 30,708 | 4.5% |
[ 3.5% - 4.0% ] 3.98% | 1,458 | 9.5% |
[ 4.0% - 4.5% ] 4.13% | 20,720 | 6.3% |
[ 4.0% - 4.5% ] 4.30% | 26,684 | 4.2% |
[ 4.5% - 5.0% ] 4.55% | 3,582 | 4.6% |
[ 4.5% - 5.0% ] 4.62% | 6,861 | 8.9% |
[ 4.5% - 5.0% ] 4.67% | 31,963 | 5.3% |
[ 4.5% - 5.0% ] 4.75% | 14,553 | 7.2% |
[ 4.5% - 5.0% ] 4.92% | 2,945 | 13.8% |
[ 5.0% - 5.5% ] 5.48% | 1,132 | 0.91% |
[ 5.5% - 6.0% ] 5.75% | 6,571 | 6.6% |
[ 6.0% - 6.5% ] 6.19% | 339 | 16.2% |
[ 6.0% - 6.5% ] 6.30% | 3,190 | 5.1% |
[ 6.5% - 7.0% ] 6.65% | 4,899 | 13.3% |
[ 6.5% - 7.0% ] 6.78% | 1,651 | 23.5% |
[ 7.0% - 7.5% ] 7.21% | 971 | 1.6% |
[ 7.0% - 7.5% ] 7.24% | 24,892 | 3.8% |
[ 7.5% - 8.0% ] 7.81% | 32,559 | 1.9% |
[ 11.0% - 11.5% ] 11.18% | 456 | 19.8% |