Immigrants from Nepal Disability
COMPARE
Immigrants from Nepal
Select to Compare
Disability
Immigrants from Nepal Disability
10.8%
DISABILITY
99.9/ 100
METRIC RATING
42nd/ 347
METRIC RANK
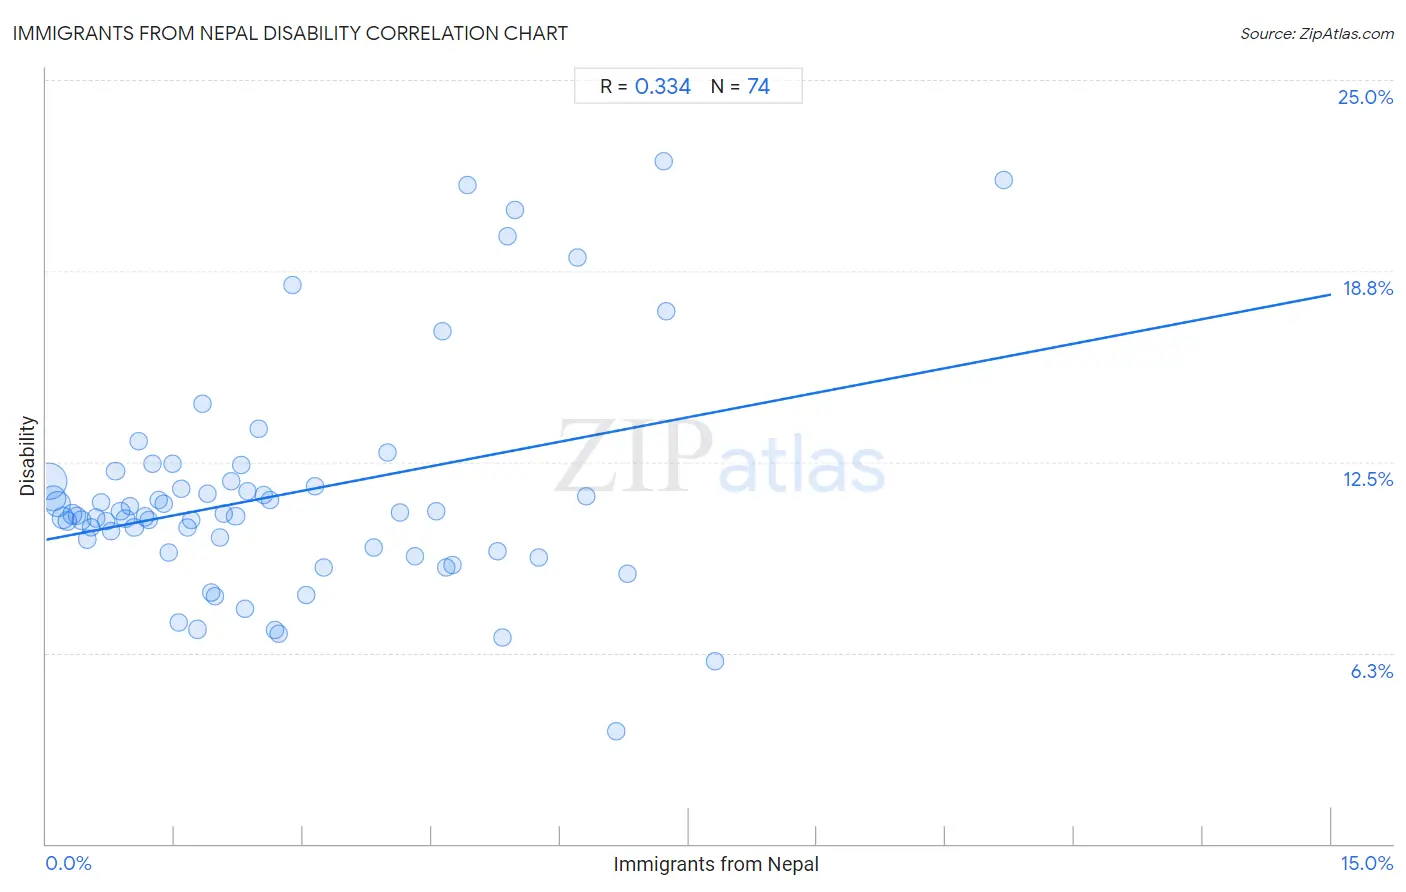
Immigrants from Nepal Disability Correlation Chart
The statistical analysis conducted on geographies consisting of 186,790,977 people shows a mild positive correlation between the proportion of Immigrants from Nepal and percentage of population with a disability in the United States with a correlation coefficient (R) of 0.334 and weighted average of 10.8%. On average, for every 1% (one percent) increase in Immigrants from Nepal within a typical geography, there is an increase of 0.53% in percentage of population with a disability.
It is essential to understand that the correlation between the percentage of Immigrants from Nepal and percentage of population with a disability does not imply a direct cause-and-effect relationship. It remains uncertain whether the presence of Immigrants from Nepal influences an upward or downward trend in the level of percentage of population with a disability within an area, or if Immigrants from Nepal simply ended up residing in those areas with higher or lower levels of percentage of population with a disability due to other factors.
Demographics Similar to Immigrants from Nepal by Disability
In terms of disability, the demographic groups most similar to Immigrants from Nepal are Israeli (10.8%, a difference of 0.050%), Immigrants from Australia (10.8%, a difference of 0.10%), Cambodian (10.8%, a difference of 0.14%), Mongolian (10.8%, a difference of 0.14%), and Immigrants from Japan (10.8%, a difference of 0.15%).
| Demographics | Rating | Rank | Disability |
| Immigrants from Indonesia | 100.0 /100 | #35 | Exceptional 10.7% |
| Ethiopians | 100.0 /100 | #36 | Exceptional 10.7% |
| Turks | 100.0 /100 | #37 | Exceptional 10.7% |
| Afghans | 99.9 /100 | #38 | Exceptional 10.8% |
| Cambodians | 99.9 /100 | #39 | Exceptional 10.8% |
| Mongolians | 99.9 /100 | #40 | Exceptional 10.8% |
| Immigrants from Australia | 99.9 /100 | #41 | Exceptional 10.8% |
| Immigrants from Nepal | 99.9 /100 | #42 | Exceptional 10.8% |
| Israelis | 99.9 /100 | #43 | Exceptional 10.8% |
| Immigrants from Japan | 99.9 /100 | #44 | Exceptional 10.8% |
| Immigrants from Peru | 99.9 /100 | #45 | Exceptional 10.8% |
| Tongans | 99.9 /100 | #46 | Exceptional 10.8% |
| Taiwanese | 99.9 /100 | #47 | Exceptional 10.8% |
| Soviet Union | 99.9 /100 | #48 | Exceptional 10.9% |
| Vietnamese | 99.9 /100 | #49 | Exceptional 10.9% |
Immigrants from Nepal Disability Correlation Summary
| Measurement | Immigrants from Nepal Data | Disability Data |
| Minimum | 0.026% | 3.7% |
| Maximum | 11.2% | 22.3% |
| Range | 11.2% | 18.7% |
| Mean | 2.7% | 11.4% |
| Median | 2.1% | 10.8% |
| Interquartile 25% (IQ1) | 1.0% | 9.6% |
| Interquartile 75% (IQ3) | 4.3% | 11.9% |
| Interquartile Range (IQR) | 3.3% | 2.3% |
| Standard Deviation (Sample) | 2.3% | 3.7% |
| Standard Deviation (Population) | 2.3% | 3.6% |
Correlation Details
| Immigrants from Nepal Percentile | Sample Size | Disability |
[ 0.0% - 0.5% ] 0.026% | 77,665,403 | 11.9% |
[ 0.0% - 0.5% ] 0.080% | 34,303,441 | 11.3% |
[ 0.0% - 0.5% ] 0.14% | 28,171,873 | 11.1% |
[ 0.0% - 0.5% ] 0.19% | 12,256,393 | 10.7% |
[ 0.0% - 0.5% ] 0.25% | 6,932,958 | 10.6% |
[ 0.0% - 0.5% ] 0.30% | 6,081,773 | 10.8% |
[ 0.0% - 0.5% ] 0.36% | 3,895,695 | 10.7% |
[ 0.0% - 0.5% ] 0.41% | 3,335,429 | 10.6% |
[ 0.0% - 0.5% ] 0.48% | 1,886,016 | 10.0% |
[ 0.5% - 1.0% ] 0.52% | 1,622,167 | 10.4% |
[ 0.5% - 1.0% ] 0.58% | 1,494,963 | 10.7% |
[ 0.5% - 1.0% ] 0.64% | 1,133,316 | 11.2% |
[ 0.5% - 1.0% ] 0.70% | 1,040,231 | 10.6% |
[ 0.5% - 1.0% ] 0.75% | 979,898 | 10.2% |
[ 0.5% - 1.0% ] 0.81% | 810,202 | 12.2% |
[ 0.5% - 1.0% ] 0.87% | 246,936 | 10.9% |
[ 0.5% - 1.0% ] 0.93% | 375,683 | 10.6% |
[ 0.5% - 1.0% ] 0.98% | 448,162 | 11.0% |
[ 1.0% - 1.5% ] 1.03% | 413,124 | 10.4% |
[ 1.0% - 1.5% ] 1.08% | 622,579 | 13.2% |
[ 1.0% - 1.5% ] 1.15% | 333,013 | 10.7% |
[ 1.0% - 1.5% ] 1.20% | 205,917 | 10.6% |
[ 1.0% - 1.5% ] 1.24% | 169,187 | 12.4% |
[ 1.0% - 1.5% ] 1.32% | 191,518 | 11.2% |
[ 1.0% - 1.5% ] 1.37% | 142,920 | 11.1% |
[ 1.0% - 1.5% ] 1.42% | 69,948 | 9.5% |
[ 1.0% - 1.5% ] 1.48% | 27,554 | 12.5% |
[ 1.5% - 2.0% ] 1.54% | 80,206 | 7.3% |
[ 1.5% - 2.0% ] 1.58% | 46,945 | 11.6% |
[ 1.5% - 2.0% ] 1.65% | 178,897 | 10.3% |
[ 1.5% - 2.0% ] 1.70% | 100,652 | 10.6% |
[ 1.5% - 2.0% ] 1.76% | 107,656 | 7.0% |
[ 1.5% - 2.0% ] 1.83% | 21,021 | 14.4% |
[ 1.5% - 2.0% ] 1.88% | 99,942 | 11.4% |
[ 1.5% - 2.0% ] 1.93% | 24,975 | 8.2% |
[ 1.5% - 2.0% ] 1.96% | 358,784 | 8.1% |
[ 2.0% - 2.5% ] 2.04% | 4,471 | 10.0% |
[ 2.0% - 2.5% ] 2.07% | 241 | 10.8% |
[ 2.0% - 2.5% ] 2.16% | 54,548 | 11.9% |
[ 2.0% - 2.5% ] 2.21% | 109,029 | 10.7% |
[ 2.0% - 2.5% ] 2.28% | 26,531 | 12.4% |
[ 2.0% - 2.5% ] 2.32% | 28,055 | 7.7% |
[ 2.0% - 2.5% ] 2.35% | 43,568 | 11.6% |
[ 2.0% - 2.5% ] 2.48% | 14,052 | 13.6% |
[ 2.5% - 3.0% ] 2.54% | 55,349 | 11.4% |
[ 2.5% - 3.0% ] 2.61% | 8,194 | 11.3% |
[ 2.5% - 3.0% ] 2.66% | 54,628 | 7.0% |
[ 2.5% - 3.0% ] 2.72% | 112,629 | 6.9% |
[ 2.5% - 3.0% ] 2.87% | 17,107 | 18.3% |
[ 3.0% - 3.5% ] 3.04% | 115,734 | 8.1% |
[ 3.0% - 3.5% ] 3.13% | 38,632 | 11.7% |
[ 3.0% - 3.5% ] 3.24% | 11,364 | 9.0% |
[ 3.5% - 4.0% ] 3.82% | 32,951 | 9.7% |
[ 3.5% - 4.0% ] 3.98% | 1,458 | 12.8% |
[ 4.0% - 4.5% ] 4.13% | 20,720 | 10.8% |
[ 4.0% - 4.5% ] 4.30% | 26,684 | 9.4% |
[ 4.5% - 5.0% ] 4.55% | 3,582 | 10.9% |
[ 4.5% - 5.0% ] 4.62% | 6,861 | 16.8% |
[ 4.5% - 5.0% ] 4.67% | 31,963 | 9.0% |
[ 4.5% - 5.0% ] 4.75% | 14,553 | 9.1% |
[ 4.5% - 5.0% ] 4.92% | 2,945 | 21.6% |
[ 5.0% - 5.5% ] 5.26% | 209 | 9.6% |
[ 5.0% - 5.5% ] 5.32% | 1,936 | 6.8% |
[ 5.0% - 5.5% ] 5.39% | 946 | 19.9% |
[ 5.0% - 5.5% ] 5.48% | 1,132 | 20.7% |
[ 5.5% - 6.0% ] 5.75% | 6,571 | 9.4% |
[ 6.0% - 6.5% ] 6.19% | 339 | 19.2% |
[ 6.0% - 6.5% ] 6.30% | 3,190 | 11.4% |
[ 6.5% - 7.0% ] 6.65% | 4,899 | 3.7% |
[ 6.5% - 7.0% ] 6.78% | 1,651 | 8.8% |
[ 7.0% - 7.5% ] 7.21% | 971 | 22.3% |
[ 7.0% - 7.5% ] 7.24% | 24,892 | 17.4% |
[ 7.5% - 8.0% ] 7.81% | 32,559 | 6.0% |
[ 11.0% - 11.5% ] 11.18% | 456 | 21.7% |