Immigrants from Moldova Self-Care Disability

COMPARE

Immigrants from Moldova
Race
Ancestry
AfghanAfricanAlaska NativeAlaskan AthabascanAlbanianAleutAlsatianAmericanApacheArabArapahoArgentineanArmenianAssyrian/Chaldean/SyriacAustralianAustrianBahamianBangladeshiBarbadianBasqueBelgianBelizeanBermudanBhutaneseBlackfeetBolivianBrazilianBritishBritish West IndianBulgarianBurmeseCajunCambodianCanadianCape VerdeanCarpatho RusynCelticCentral AmericanCentral American IndianCherokeeCheyenneChickasawChileanChineseChippewaChoctawColombianColvilleComancheCosta RicanCreeCreekCroatianCrowCubanCypriotCzechCzechoslovakianDanishDelawareDominicanDutchDutch West IndianEastern EuropeanEcuadorianEgyptianEnglishEstonianEthiopianEuropeanFijianFilipinoFinnishFrenchFrench American IndianFrench CanadianGermanGerman RussianGhanaianGreekGuamanian/ChamorroGuatemalanGuyaneseHaitianHmongHonduranHopiHoumaHungarianIcelanderIndian (Asian)IndonesianInupiatIranianIraqiIrishIroquoisIsraeliItalianJamaicanJapaneseJordanianKenyanKiowaKoreanLaotianLatvianLebaneseLiberianLithuanianLumbeeLuxembourgerMacedonianMalaysianMalteseMarshalleseMenomineeMexicanMexican American IndianMongolianMoroccanNative HawaiianNavajoNepaleseNew ZealanderNicaraguanNigerianNorthern EuropeanNorwegianOkinawanOsageOttawaPaiutePakistaniPalestinianPanamanianParaguayanPennsylvania GermanPeruvianPimaPolishPortuguesePotawatomiPuebloPuerto RicanPuget Sound SalishRomanianRussianSalvadoranSamoanScandinavianScotch-IrishScottishSeminoleSenegaleseSerbianShoshoneSierra LeoneanSiouxSlavicSlovakSloveneSomaliSouth AfricanSouth AmericanSouth American IndianSoviet UnionSpaniardSpanishSpanish AmericanSpanish American IndianSri LankanSubsaharan AfricanSudaneseSwedishSwissSyrianTaiwaneseThaiTlingit-HaidaTohono O'OdhamTonganTrinidadian and TobagonianTsimshianTurkishU.S. Virgin IslanderUgandanUkrainianUruguayanUteVenezuelanVietnameseWelshWest IndianYakamaYaquiYugoslavianYumanYup'ikZimbabwean
Immigration
NonimmigrantsImmigrantsAfghanistanAfricaAlbaniaArgentinaArmeniaAsiaAustraliaAustriaBahamasBangladeshBarbadosBelarusBelgiumBelizeBoliviaBosnia and HerzegovinaBrazilBulgariaBurma/MyanmarCabo VerdeCambodiaCameroonCanadaCaribbeanCentral AmericaChileChinaColombiaCongoCosta RicaCroatiaCubaCzechoslovakiaDenmarkDominicaDominican RepublicEastern AfricaEastern AsiaEastern EuropeEcuadorEgyptEl SalvadorEnglandEritreaEthiopiaEuropeFijiFranceGermanyGhanaGreeceGrenadaGuatemalaGuyanaHaitiHondurasHong KongHungaryIndiaIndonesiaIranIraqIrelandIsraelItalyJamaicaJapanJordanKazakhstanKenyaKoreaKuwaitLaosLatin AmericaLatviaLebanonLiberiaLithuaniaMalaysiaMexicoMicronesiaMiddle AfricaMoldovaMoroccoNepalNetherlandsNicaraguaNigeriaNorth AmericaNorth MacedoniaNorthern AfricaNorthern EuropeNorwayOceaniaPakistanPanamaPeruPhilippinesPolandPortugalRomaniaRussiaSaudi ArabiaScotlandSenegalSerbiaSierra LeoneSingaporeSomaliaSouth AfricaSouth AmericaSouth Central AsiaSouth Eastern AsiaSouthern EuropeSpainSri LankaSt. Vincent and the GrenadinesSudanSwedenSwitzerlandSyriaTaiwanThailandTrinidad and TobagoTurkeyUgandaUkraineUruguayUzbekistanVenezuelaVietnamWest IndiesWestern AfricaWestern AsiaWestern EuropeYemenZaireZimbabweAzores
Select to Compare
Race
Ancestry
AfghanAfricanAlaska NativeAlaskan AthabascanAlbanianAleutAlsatianAmericanApacheArabArapahoArgentineanArmenianAssyrian/Chaldean/SyriacAustralianAustrianBahamianBangladeshiBarbadianBasqueBelgianBelizeanBermudanBhutaneseBlackfeetBolivianBrazilianBritishBritish West IndianBulgarianBurmeseCajunCambodianCanadianCape VerdeanCarpatho RusynCelticCentral AmericanCentral American IndianCherokeeCheyenneChickasawChileanChineseChippewaChoctawColombianColvilleComancheCosta RicanCreeCreekCroatianCrowCubanCypriotCzechCzechoslovakianDanishDelawareDominicanDutchDutch West IndianEastern EuropeanEcuadorianEgyptianEnglishEstonianEthiopianEuropeanFijianFilipinoFinnishFrenchFrench American IndianFrench CanadianGermanGerman RussianGhanaianGreekGuamanian/ChamorroGuatemalanGuyaneseHaitianHmongHonduranHopiHoumaHungarianIcelanderIndian (Asian)IndonesianInupiatIranianIraqiIrishIroquoisIsraeliItalianJamaicanJapaneseJordanianKenyanKiowaKoreanLaotianLatvianLebaneseLiberianLithuanianLumbeeLuxembourgerMacedonianMalaysianMalteseMarshalleseMenomineeMexicanMexican American IndianMongolianMoroccanNative HawaiianNavajoNepaleseNew ZealanderNicaraguanNigerianNorthern EuropeanNorwegianOkinawanOsageOttawaPaiutePakistaniPalestinianPanamanianParaguayanPennsylvania GermanPeruvianPimaPolishPortuguesePotawatomiPuebloPuerto RicanPuget Sound SalishRomanianRussianSalvadoranSamoanScandinavianScotch-IrishScottishSeminoleSenegaleseSerbianShoshoneSierra LeoneanSiouxSlavicSlovakSloveneSomaliSouth AfricanSouth AmericanSouth American IndianSoviet UnionSpaniardSpanishSpanish AmericanSpanish American IndianSri LankanSubsaharan AfricanSudaneseSwedishSwissSyrianTaiwaneseThaiTlingit-HaidaTohono O'OdhamTonganTrinidadian and TobagonianTsimshianTurkishU.S. Virgin IslanderUgandanUkrainianUruguayanUteVenezuelanVietnameseWelshWest IndianYakamaYaquiYugoslavianYumanYup'ikZimbabwean
Immigration
NonimmigrantsImmigrantsAfghanistanAfricaAlbaniaArgentinaArmeniaAsiaAustraliaAustriaBahamasBangladeshBarbadosBelarusBelgiumBelizeBoliviaBosnia and HerzegovinaBrazilBulgariaBurma/MyanmarCabo VerdeCambodiaCameroonCanadaCaribbeanCentral AmericaChileChinaColombiaCongoCosta RicaCroatiaCubaCzechoslovakiaDenmarkDominicaDominican RepublicEastern AfricaEastern AsiaEastern EuropeEcuadorEgyptEl SalvadorEnglandEritreaEthiopiaEuropeFijiFranceGermanyGhanaGreeceGrenadaGuatemalaGuyanaHaitiHondurasHong KongHungaryIndiaIndonesiaIranIraqIrelandIsraelItalyJamaicaJapanJordanKazakhstanKenyaKoreaKuwaitLaosLatin AmericaLatviaLebanonLiberiaLithuaniaMalaysiaMexicoMicronesiaMiddle AfricaMoroccoNepalNetherlandsNicaraguaNigeriaNorth AmericaNorth MacedoniaNorthern AfricaNorthern EuropeNorwayOceaniaPakistanPanamaPeruPhilippinesPolandPortugalRomaniaRussiaSaudi ArabiaScotlandSenegalSerbiaSierra LeoneSingaporeSomaliaSouth AfricaSouth AmericaSouth Central AsiaSouth Eastern AsiaSouthern EuropeSpainSri LankaSt. Vincent and the GrenadinesSudanSwedenSwitzerlandSyriaTaiwanThailandTrinidad and TobagoTurkeyUgandaUkraineUruguayUzbekistanVenezuelaVietnamWest IndiesWestern AfricaWestern AsiaWestern EuropeYemenZaireZimbabweAzores
Self-Care Disability
Income
Poverty
Unemployment
Labor Participation
Family Structure
Vehicle Availability
Education Level
Disability

Immigrants from Moldova Self-Care Disability
Tragic

2.6%
SELF-CARE DISABILITY
4.0/ 100
METRIC RATING
219th/ 347
METRIC RANK

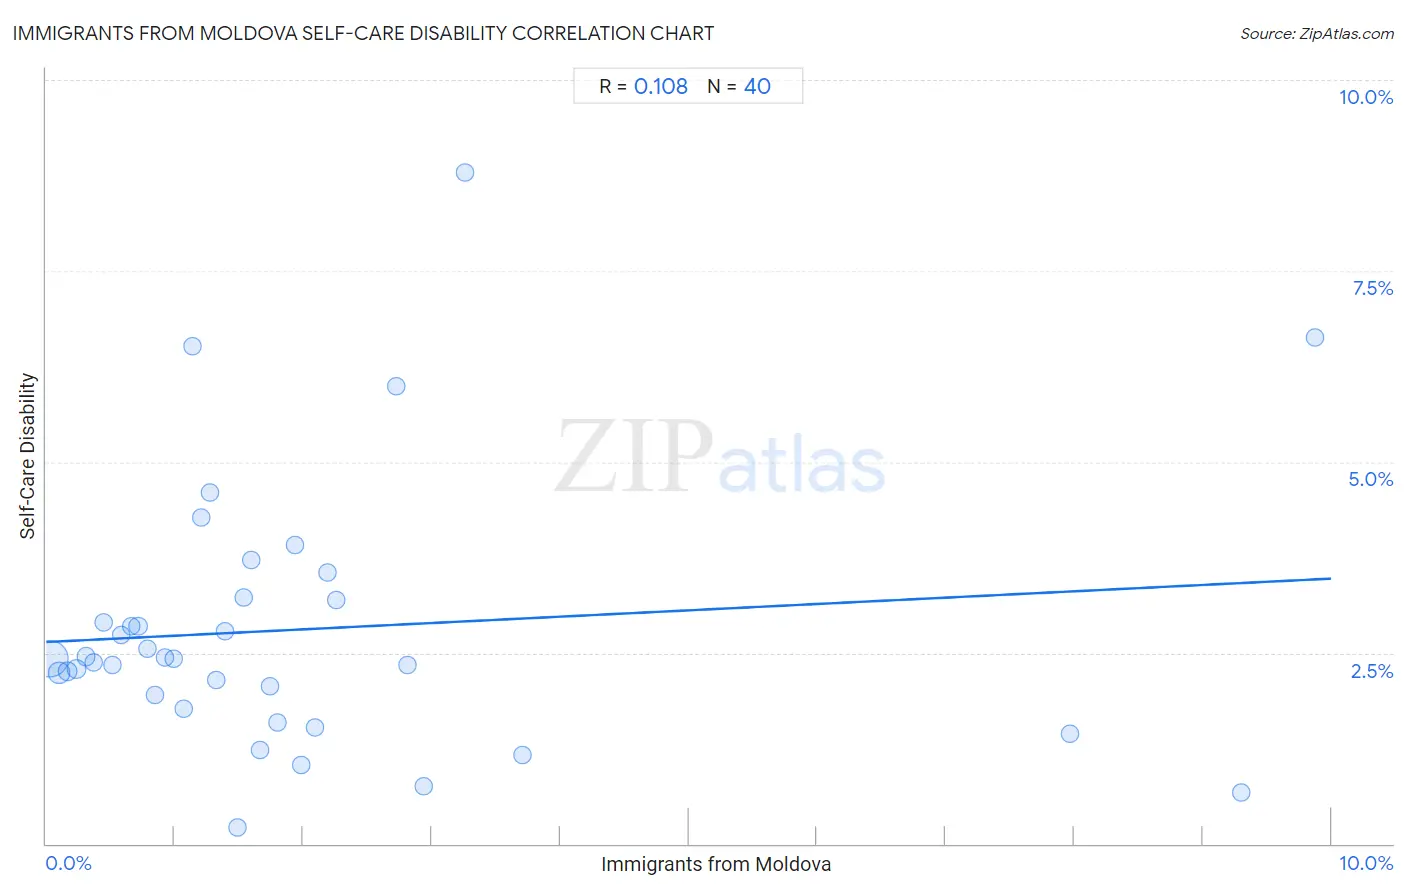
Immigrants from Moldova Self-Care Disability Correlation Chart

The statistical analysis conducted on geographies consisting of 124,345,596 people shows a poor positive correlation between the proportion of Immigrants from Moldova and percentage of population with self-care disability in the United States with a correlation coefficient (R) of 0.108 and weighted average of 2.6%. On average, for every 1% (one percent) increase in Immigrants from Moldova within a typical geography, there is an increase of 0.083% in percentage of population with self-care disability.
Immigrants from Moldova Self-Care Disability
It is essential to understand that the correlation between the percentage of Immigrants from Moldova and percentage of population with self-care disability does not imply a direct cause-and-effect relationship. It remains uncertain whether the presence of Immigrants from Moldova influences an upward or downward trend in the level of percentage of population with self-care disability within an area, or if Immigrants from Moldova simply ended up residing in those areas with higher or lower levels of percentage of population with self-care disability due to other factors.

Demographics Similar to Immigrants from Moldova by Self-Care Disability

In terms of self-care disability, the demographic groups most similar to Immigrants from Moldova are Subsaharan African (2.6%, a difference of 0.010%), Scotch-Irish (2.6%, a difference of 0.030%), Honduran (2.6%, a difference of 0.050%), Spaniard (2.6%, a difference of 0.060%), and French Canadian (2.6%, a difference of 0.060%).
DemographicsRating | RankSelf-Care Disability
Samoans
5.1
/100
|
#212
Tragic
2.6%
Ecuadorians
4.7
/100
|
#213
Tragic
2.6%
Immigrants from Honduras
4.7
/100
|
#214
Tragic
2.6%
Immigrants from Thailand
4.5
/100
|
#215
Tragic
2.6%
Whites/Caucasians
4.4
/100
|
#216
Tragic
2.6%
Celtics
4.4
/100
|
#217
Tragic
2.6%
Scotch-Irish
4.1
/100
|
#218
Tragic
2.6%
Immigrants from Moldova
4.0
/100
|
#219
Tragic
2.6%
Sub-Saharan Africans
4.0
/100
|
#220
Tragic
2.6%
Hondurans
3.8
/100
|
#221
Tragic
2.6%
Spaniards
3.8
/100
|
#222
Tragic
2.6%
French Canadians
3.8
/100
|
#223
Tragic
2.6%
Osage
3.6
/100
|
#224
Tragic
2.6%
Iraqis
3.2
/100
|
#225
Tragic
2.6%
Chinese
2.9
/100
|
#226
Tragic
2.6%

Immigrants from Moldova Self-Care Disability Correlation Summary

MeasurementImmigrants from Moldova DataSelf-Care Disability Data
Minimum0.026%0.22%
Maximum9.9%8.8%
Range9.9%8.6%
Mean1.9%2.8%
Median1.4%2.4%
Interquartile 25% (IQ1)0.69%1.9%
Interquartile 75% (IQ3)2.1%3.2%
Interquartile Range (IQR)1.5%1.4%
Standard Deviation (Sample)2.2%1.7%
Standard Deviation (Population)2.2%1.7%

Correlation Details

Immigrants from Moldova PercentileSample SizeSelf-Care Disability
[
0.0%
-
0.5%
]
0.026%
92,797,9312.4%
[
0.0%
-
0.5%
]
0.098%
15,279,1062.2%
[
0.0%
-
0.5%
]
0.17%
5,594,6982.3%
[
0.0%
-
0.5%
]
0.24%
3,432,3172.3%
[
0.0%
-
0.5%
]
0.31%
2,213,0032.5%
[
0.0%
-
0.5%
]
0.37%
855,7652.4%
[
0.0%
-
0.5%
]
0.45%
1,061,3922.9%
[
0.5%
-
1.0%
]
0.52%
444,0262.3%
[
0.5%
-
1.0%
]
0.59%
471,4632.7%
[
0.5%
-
1.0%
]
0.66%
295,4372.8%
[
0.5%
-
1.0%
]
0.71%
300,1252.9%
[
0.5%
-
1.0%
]
0.79%
268,9712.5%
[
0.5%
-
1.0%
]
0.85%
132,7071.9%
[
0.5%
-
1.0%
]
0.93%
173,0192.4%
[
0.5%
-
1.0%
]
1.00%
223,2012.4%
[
1.0%
-
1.5%
]
1.07%
44,1781.8%
[
1.0%
-
1.5%
]
1.14%
87,6996.5%
[
1.0%
-
1.5%
]
1.20%
47,9344.3%
[
1.0%
-
1.5%
]
1.28%
132,6244.6%
[
1.0%
-
1.5%
]
1.33%
25,7792.1%
[
1.0%
-
1.5%
]
1.39%
72,6012.8%
[
1.0%
-
1.5%
]
1.49%
4700.22%
[
1.5%
-
2.0%
]
1.54%
184,7823.2%
[
1.5%
-
2.0%
]
1.59%
127,2863.7%
[
1.5%
-
2.0%
]
1.67%
6,0041.2%
[
1.5%
-
2.0%
]
1.74%
17,5262.1%
[
1.5%
-
2.0%
]
1.80%
3,6201.6%
[
1.5%
-
2.0%
]
1.94%
21,0843.9%
[
1.5%
-
2.0%
]
1.98%
1,0091.0%
[
2.0%
-
2.5%
]
2.09%
2,5831.5%
[
2.0%
-
2.5%
]
2.19%
7,2183.5%
[
2.0%
-
2.5%
]
2.26%
2,5683.2%
[
2.5%
-
3.0%
]
2.72%
4,9266.0%
[
2.5%
-
3.0%
]
2.81%
2,6312.3%
[
2.5%
-
3.0%
]
2.94%
6800.76%
[
3.0%
-
3.5%
]
3.26%
1,6588.8%
[
3.5%
-
4.0%
]
3.70%
2,3771.2%
[
7.5%
-
8.0%
]
7.97%
2,5601.4%
[
9.0%
-
9.5%
]
9.30%
1,9900.67%
[
9.5%
-
10.0%
]
9.88%
6486.6%