Immigrants from Moldova 4 or more Vehicles in Household
COMPARE
Immigrants from Moldova
Select to Compare
4 or more Vehicles in Household
Immigrants from Moldova 4 or more Vehicles in Household
6.0%
4+ VEHICLES AVAILABLE
9.3/ 100
METRIC RATING
221st/ 347
METRIC RANK
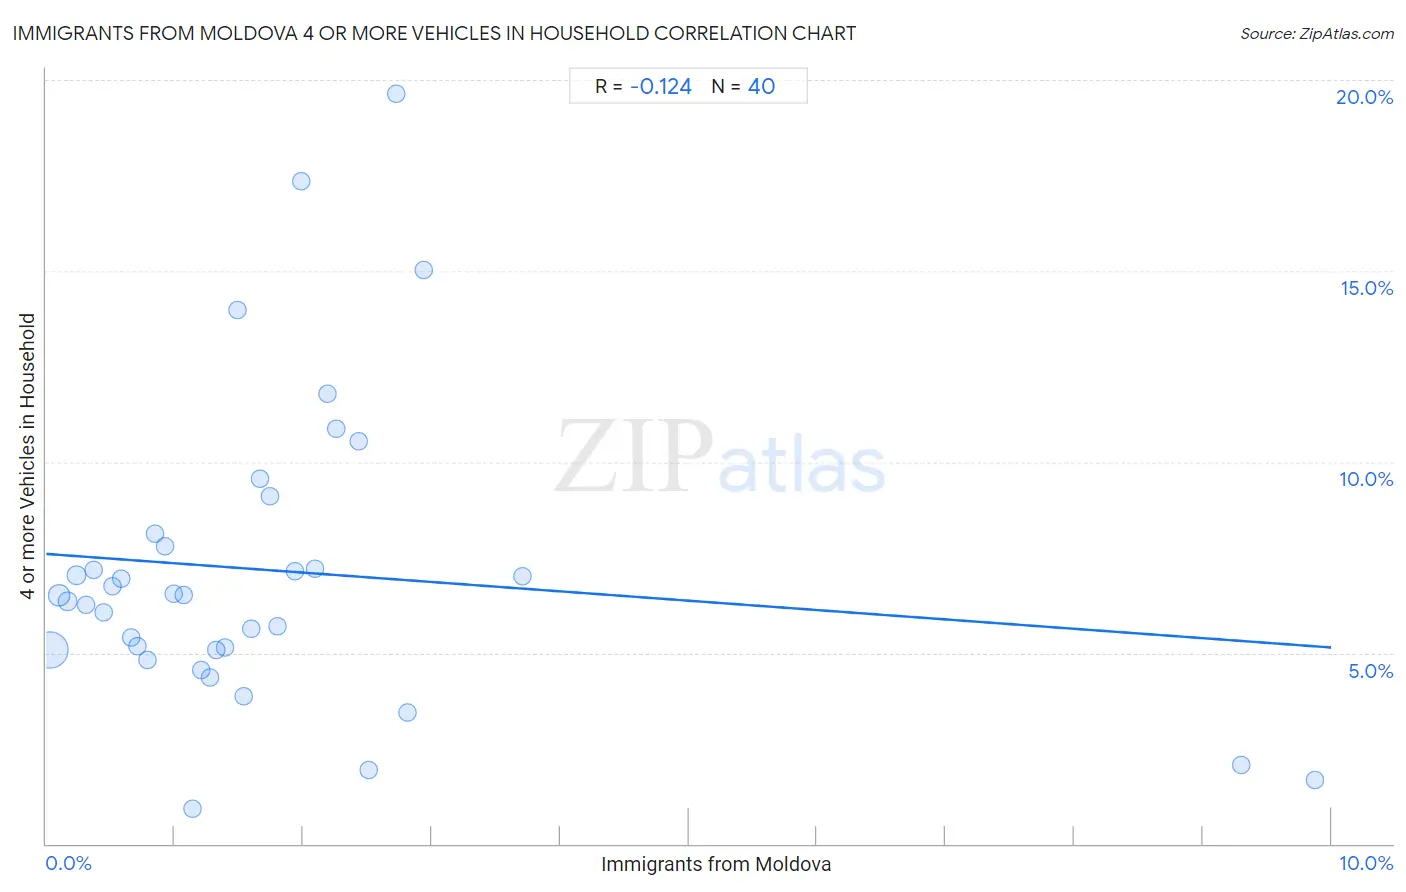
Immigrants from Moldova 4 or more Vehicles in Household Correlation Chart
The statistical analysis conducted on geographies consisting of 123,950,507 people shows a poor negative correlation between the proportion of Immigrants from Moldova and percentage of households with 4 or more vehicles available in the United States with a correlation coefficient (R) of -0.124 and weighted average of 6.0%. On average, for every 1% (one percent) increase in Immigrants from Moldova within a typical geography, there is a decrease of 0.25% in percentage of households with 4 or more vehicles available.
It is essential to understand that the correlation between the percentage of Immigrants from Moldova and percentage of households with 4 or more vehicles available does not imply a direct cause-and-effect relationship. It remains uncertain whether the presence of Immigrants from Moldova influences an upward or downward trend in the level of percentage of households with 4 or more vehicles available within an area, or if Immigrants from Moldova simply ended up residing in those areas with higher or lower levels of percentage of households with 4 or more vehicles available due to other factors.
Demographics Similar to Immigrants from Moldova by 4 or more Vehicles in Household
In terms of 4 or more vehicles in household, the demographic groups most similar to Immigrants from Moldova are Cajun (6.0%, a difference of 0.030%), Immigrants from Kenya (6.0%, a difference of 0.030%), Cuban (6.0%, a difference of 0.050%), Indonesian (6.0%, a difference of 0.13%), and Russian (6.0%, a difference of 0.29%).
| Demographics | Rating | Rank | 4 or more Vehicles in Household |
| Immigrants from Austria | 14.3 /100 | #214 | Poor 6.0% |
| Immigrants from China | 13.8 /100 | #215 | Poor 6.0% |
| Immigrants from Romania | 13.8 /100 | #216 | Poor 6.0% |
| Nigerians | 12.2 /100 | #217 | Poor 6.0% |
| Immigrants from Italy | 11.0 /100 | #218 | Poor 6.0% |
| Serbians | 11.0 /100 | #219 | Poor 6.0% |
| Russians | 10.3 /100 | #220 | Poor 6.0% |
| Immigrants from Moldova | 9.3 /100 | #221 | Tragic 6.0% |
| Cajuns | 9.2 /100 | #222 | Tragic 6.0% |
| Immigrants from Kenya | 9.2 /100 | #223 | Tragic 6.0% |
| Cubans | 9.2 /100 | #224 | Tragic 6.0% |
| Indonesians | 8.9 /100 | #225 | Tragic 6.0% |
| Immigrants from Singapore | 7.9 /100 | #226 | Tragic 5.9% |
| Immigrants from Western Asia | 7.8 /100 | #227 | Tragic 5.9% |
| Immigrants from Uganda | 7.5 /100 | #228 | Tragic 5.9% |
Immigrants from Moldova 4 or more Vehicles in Household Correlation Summary
| Measurement | Immigrants from Moldova Data | 4 or more Vehicles in Household Data |
| Minimum | 0.026% | 0.92% |
| Maximum | 9.9% | 19.6% |
| Range | 9.9% | 18.7% |
| Mean | 1.8% | 7.2% |
| Median | 1.4% | 6.5% |
| Interquartile 25% (IQ1) | 0.69% | 5.1% |
| Interquartile 75% (IQ3) | 2.1% | 7.9% |
| Interquartile Range (IQR) | 1.5% | 2.9% |
| Standard Deviation (Sample) | 2.0% | 4.0% |
| Standard Deviation (Population) | 2.0% | 3.9% |
Correlation Details
| Immigrants from Moldova Percentile | Sample Size | 4 or more Vehicles in Household |
[ 0.0% - 0.5% ] 0.026% | 92,637,390 | 5.1% |
[ 0.0% - 0.5% ] 0.098% | 15,192,196 | 6.5% |
[ 0.0% - 0.5% ] 0.17% | 5,481,535 | 6.4% |
[ 0.0% - 0.5% ] 0.24% | 3,432,317 | 7.0% |
[ 0.0% - 0.5% ] 0.31% | 2,204,434 | 6.3% |
[ 0.0% - 0.5% ] 0.37% | 859,214 | 7.2% |
[ 0.0% - 0.5% ] 0.45% | 1,043,627 | 6.1% |
[ 0.5% - 1.0% ] 0.52% | 441,616 | 6.8% |
[ 0.5% - 1.0% ] 0.59% | 464,406 | 6.9% |
[ 0.5% - 1.0% ] 0.66% | 295,437 | 5.4% |
[ 0.5% - 1.0% ] 0.71% | 297,454 | 5.2% |
[ 0.5% - 1.0% ] 0.79% | 268,971 | 4.8% |
[ 0.5% - 1.0% ] 0.85% | 132,707 | 8.1% |
[ 0.5% - 1.0% ] 0.93% | 173,019 | 7.8% |
[ 0.5% - 1.0% ] 1.00% | 223,201 | 6.6% |
[ 1.0% - 1.5% ] 1.07% | 45,054 | 6.5% |
[ 1.0% - 1.5% ] 1.14% | 87,699 | 0.92% |
[ 1.0% - 1.5% ] 1.20% | 47,934 | 4.5% |
[ 1.0% - 1.5% ] 1.28% | 132,624 | 4.3% |
[ 1.0% - 1.5% ] 1.33% | 25,779 | 5.1% |
[ 1.0% - 1.5% ] 1.39% | 72,601 | 5.1% |
[ 1.0% - 1.5% ] 1.49% | 470 | 14.0% |
[ 1.5% - 2.0% ] 1.54% | 184,782 | 3.9% |
[ 1.5% - 2.0% ] 1.59% | 129,850 | 5.6% |
[ 1.5% - 2.0% ] 1.67% | 6,004 | 9.6% |
[ 1.5% - 2.0% ] 1.74% | 17,526 | 9.1% |
[ 1.5% - 2.0% ] 1.80% | 3,620 | 5.7% |
[ 1.5% - 2.0% ] 1.94% | 21,084 | 7.1% |
[ 1.5% - 2.0% ] 1.98% | 1,009 | 17.3% |
[ 2.0% - 2.5% ] 2.09% | 2,583 | 7.2% |
[ 2.0% - 2.5% ] 2.19% | 7,218 | 11.8% |
[ 2.0% - 2.5% ] 2.26% | 2,568 | 10.9% |
[ 2.0% - 2.5% ] 2.43% | 370 | 10.5% |
[ 2.5% - 3.0% ] 2.51% | 956 | 1.9% |
[ 2.5% - 3.0% ] 2.72% | 4,926 | 19.6% |
[ 2.5% - 3.0% ] 2.81% | 2,631 | 3.4% |
[ 2.5% - 3.0% ] 2.94% | 680 | 15.0% |
[ 3.5% - 4.0% ] 3.70% | 2,377 | 7.0% |
[ 9.0% - 9.5% ] 9.30% | 1,990 | 2.0% |
[ 9.5% - 10.0% ] 9.88% | 648 | 1.7% |