Immigrants from Moldova GED/Equivalency

COMPARE

Immigrants from Moldova
Race
Ancestry
AfghanAfricanAlaska NativeAlaskan AthabascanAlbanianAleutAlsatianAmericanApacheArabArapahoArgentineanArmenianAssyrian/Chaldean/SyriacAustralianAustrianBahamianBangladeshiBarbadianBasqueBelgianBelizeanBermudanBhutaneseBlackfeetBolivianBrazilianBritishBritish West IndianBulgarianBurmeseCajunCambodianCanadianCape VerdeanCarpatho RusynCelticCentral AmericanCentral American IndianCherokeeCheyenneChickasawChileanChineseChippewaChoctawColombianColvilleComancheCosta RicanCreeCreekCroatianCrowCubanCypriotCzechCzechoslovakianDanishDelawareDominicanDutchDutch West IndianEastern EuropeanEcuadorianEgyptianEnglishEstonianEthiopianEuropeanFijianFilipinoFinnishFrenchFrench American IndianFrench CanadianGermanGerman RussianGhanaianGreekGuamanian/ChamorroGuatemalanGuyaneseHaitianHmongHonduranHopiHoumaHungarianIcelanderIndian (Asian)IndonesianInupiatIranianIraqiIrishIroquoisIsraeliItalianJamaicanJapaneseJordanianKenyanKiowaKoreanLaotianLatvianLebaneseLiberianLithuanianLumbeeLuxembourgerMacedonianMalaysianMalteseMarshalleseMenomineeMexicanMexican American IndianMongolianMoroccanNative HawaiianNavajoNepaleseNew ZealanderNicaraguanNigerianNorthern EuropeanNorwegianOkinawanOsageOttawaPaiutePakistaniPalestinianPanamanianParaguayanPennsylvania GermanPeruvianPimaPolishPortuguesePotawatomiPuebloPuerto RicanPuget Sound SalishRomanianRussianSalvadoranSamoanScandinavianScotch-IrishScottishSeminoleSenegaleseSerbianShoshoneSierra LeoneanSiouxSlavicSlovakSloveneSomaliSouth AfricanSouth AmericanSouth American IndianSoviet UnionSpaniardSpanishSpanish AmericanSpanish American IndianSri LankanSubsaharan AfricanSudaneseSwedishSwissSyrianTaiwaneseThaiTlingit-HaidaTohono O'OdhamTonganTrinidadian and TobagonianTsimshianTurkishU.S. Virgin IslanderUgandanUkrainianUruguayanUteVenezuelanVietnameseWelshWest IndianYakamaYaquiYugoslavianYumanYup'ikZimbabwean
Immigration
NonimmigrantsImmigrantsAfghanistanAfricaAlbaniaArgentinaArmeniaAsiaAustraliaAustriaBahamasBangladeshBarbadosBelarusBelgiumBelizeBoliviaBosnia and HerzegovinaBrazilBulgariaBurma/MyanmarCabo VerdeCambodiaCameroonCanadaCaribbeanCentral AmericaChileChinaColombiaCongoCosta RicaCroatiaCubaCzechoslovakiaDenmarkDominicaDominican RepublicEastern AfricaEastern AsiaEastern EuropeEcuadorEgyptEl SalvadorEnglandEritreaEthiopiaEuropeFijiFranceGermanyGhanaGreeceGrenadaGuatemalaGuyanaHaitiHondurasHong KongHungaryIndiaIndonesiaIranIraqIrelandIsraelItalyJamaicaJapanJordanKazakhstanKenyaKoreaKuwaitLaosLatin AmericaLatviaLebanonLiberiaLithuaniaMalaysiaMexicoMicronesiaMiddle AfricaMoldovaMoroccoNepalNetherlandsNicaraguaNigeriaNorth AmericaNorth MacedoniaNorthern AfricaNorthern EuropeNorwayOceaniaPakistanPanamaPeruPhilippinesPolandPortugalRomaniaRussiaSaudi ArabiaScotlandSenegalSerbiaSierra LeoneSingaporeSomaliaSouth AfricaSouth AmericaSouth Central AsiaSouth Eastern AsiaSouthern EuropeSpainSri LankaSt. Vincent and the GrenadinesSudanSwedenSwitzerlandSyriaTaiwanThailandTrinidad and TobagoTurkeyUgandaUkraineUruguayUzbekistanVenezuelaVietnamWest IndiesWestern AfricaWestern AsiaWestern EuropeYemenZaireZimbabweAzores
Select to Compare
Race
Ancestry
AfghanAfricanAlaska NativeAlaskan AthabascanAlbanianAleutAlsatianAmericanApacheArabArapahoArgentineanArmenianAssyrian/Chaldean/SyriacAustralianAustrianBahamianBangladeshiBarbadianBasqueBelgianBelizeanBermudanBhutaneseBlackfeetBolivianBrazilianBritishBritish West IndianBulgarianBurmeseCajunCambodianCanadianCape VerdeanCarpatho RusynCelticCentral AmericanCentral American IndianCherokeeCheyenneChickasawChileanChineseChippewaChoctawColombianColvilleComancheCosta RicanCreeCreekCroatianCrowCubanCypriotCzechCzechoslovakianDanishDelawareDominicanDutchDutch West IndianEastern EuropeanEcuadorianEgyptianEnglishEstonianEthiopianEuropeanFijianFilipinoFinnishFrenchFrench American IndianFrench CanadianGermanGerman RussianGhanaianGreekGuamanian/ChamorroGuatemalanGuyaneseHaitianHmongHonduranHopiHoumaHungarianIcelanderIndian (Asian)IndonesianInupiatIranianIraqiIrishIroquoisIsraeliItalianJamaicanJapaneseJordanianKenyanKiowaKoreanLaotianLatvianLebaneseLiberianLithuanianLumbeeLuxembourgerMacedonianMalaysianMalteseMarshalleseMenomineeMexicanMexican American IndianMongolianMoroccanNative HawaiianNavajoNepaleseNew ZealanderNicaraguanNigerianNorthern EuropeanNorwegianOkinawanOsageOttawaPaiutePakistaniPalestinianPanamanianParaguayanPennsylvania GermanPeruvianPimaPolishPortuguesePotawatomiPuebloPuerto RicanPuget Sound SalishRomanianRussianSalvadoranSamoanScandinavianScotch-IrishScottishSeminoleSenegaleseSerbianShoshoneSierra LeoneanSiouxSlavicSlovakSloveneSomaliSouth AfricanSouth AmericanSouth American IndianSoviet UnionSpaniardSpanishSpanish AmericanSpanish American IndianSri LankanSubsaharan AfricanSudaneseSwedishSwissSyrianTaiwaneseThaiTlingit-HaidaTohono O'OdhamTonganTrinidadian and TobagonianTsimshianTurkishU.S. Virgin IslanderUgandanUkrainianUruguayanUteVenezuelanVietnameseWelshWest IndianYakamaYaquiYugoslavianYumanYup'ikZimbabwean
Immigration
NonimmigrantsImmigrantsAfghanistanAfricaAlbaniaArgentinaArmeniaAsiaAustraliaAustriaBahamasBangladeshBarbadosBelarusBelgiumBelizeBoliviaBosnia and HerzegovinaBrazilBulgariaBurma/MyanmarCabo VerdeCambodiaCameroonCanadaCaribbeanCentral AmericaChileChinaColombiaCongoCosta RicaCroatiaCubaCzechoslovakiaDenmarkDominicaDominican RepublicEastern AfricaEastern AsiaEastern EuropeEcuadorEgyptEl SalvadorEnglandEritreaEthiopiaEuropeFijiFranceGermanyGhanaGreeceGrenadaGuatemalaGuyanaHaitiHondurasHong KongHungaryIndiaIndonesiaIranIraqIrelandIsraelItalyJamaicaJapanJordanKazakhstanKenyaKoreaKuwaitLaosLatin AmericaLatviaLebanonLiberiaLithuaniaMalaysiaMexicoMicronesiaMiddle AfricaMoroccoNepalNetherlandsNicaraguaNigeriaNorth AmericaNorth MacedoniaNorthern AfricaNorthern EuropeNorwayOceaniaPakistanPanamaPeruPhilippinesPolandPortugalRomaniaRussiaSaudi ArabiaScotlandSenegalSerbiaSierra LeoneSingaporeSomaliaSouth AfricaSouth AmericaSouth Central AsiaSouth Eastern AsiaSouthern EuropeSpainSri LankaSt. Vincent and the GrenadinesSudanSwedenSwitzerlandSyriaTaiwanThailandTrinidad and TobagoTurkeyUgandaUkraineUruguayUzbekistanVenezuelaVietnamWest IndiesWestern AfricaWestern AsiaWestern EuropeYemenZaireZimbabweAzores
GED/Equivalency
Income
Poverty
Unemployment
Labor Participation
Family Structure
Vehicle Availability
Education Level
Disability

Immigrants from Moldova GED/Equivalency
Exceptional

87.7%
GED/EQUIVALENCY
98.8/ 100
METRIC RATING
72nd/ 347
METRIC RANK

Immigrants from Moldova GED/Equivalency Correlation Chart

The statistical analysis conducted on geographies consisting of 124,401,069 people shows a weak positive correlation between the proportion of Immigrants from Moldova and percentage of population with at least ged/equivalency education in the United States with a correlation coefficient (R) of 0.283 and weighted average of 87.7%. On average, for every 1% (one percent) increase in Immigrants from Moldova within a typical geography, there is an increase of 0.68% in percentage of population with at least ged/equivalency education.
Immigrants from Moldova GED/Equivalency
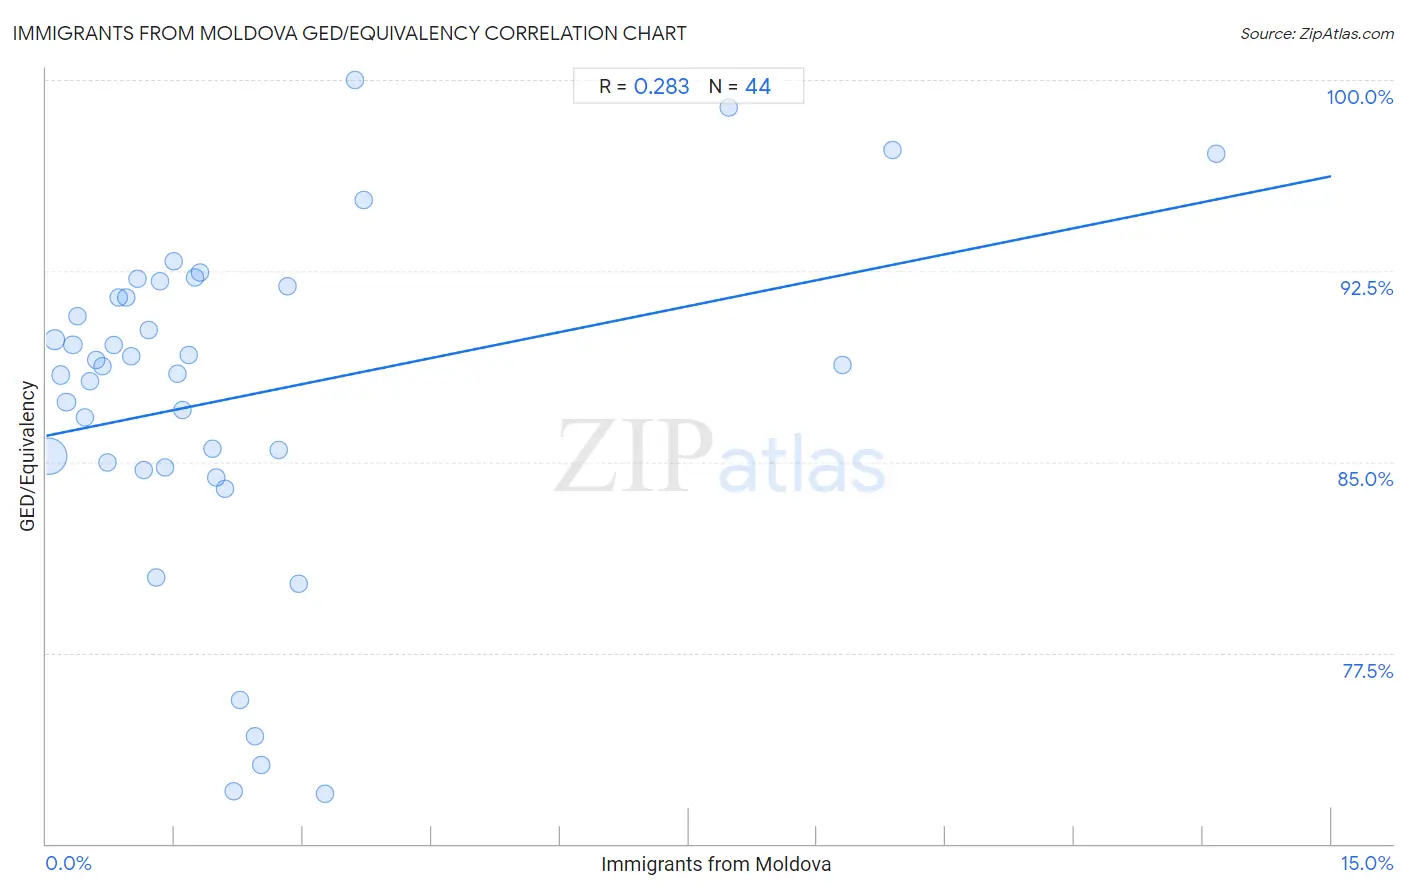
It is essential to understand that the correlation between the percentage of Immigrants from Moldova and percentage of population with at least ged/equivalency education does not imply a direct cause-and-effect relationship. It remains uncertain whether the presence of Immigrants from Moldova influences an upward or downward trend in the level of percentage of population with at least ged/equivalency education within an area, or if Immigrants from Moldova simply ended up residing in those areas with higher or lower levels of percentage of population with at least ged/equivalency education due to other factors.

Demographics Similar to Immigrants from Moldova by GED/Equivalency

In terms of ged/equivalency, the demographic groups most similar to Immigrants from Moldova are Ukrainian (87.7%, a difference of 0.0%), Austrian (87.7%, a difference of 0.0%), Belgian (87.7%, a difference of 0.010%), Immigrants from Kuwait (87.7%, a difference of 0.030%), and Immigrants from Saudi Arabia (87.8%, a difference of 0.050%).
DemographicsRating | RankGED/Equivalency
Immigrants from North America
99.1
/100
|
#65
Exceptional
87.8%
Immigrants from Bulgaria
99.1
/100
|
#66
Exceptional
87.8%
British
99.1
/100
|
#67
Exceptional
87.8%
Immigrants from France
99.1
/100
|
#68
Exceptional
87.8%
Immigrants from Saudi Arabia
99.0
/100
|
#69
Exceptional
87.8%
Ukrainians
98.8
/100
|
#70
Exceptional
87.7%
Austrians
98.8
/100
|
#71
Exceptional
87.7%
Immigrants from Moldova
98.8
/100
|
#72
Exceptional
87.7%
Belgians
98.8
/100
|
#73
Exceptional
87.7%
Immigrants from Kuwait
98.8
/100
|
#74
Exceptional
87.7%
Scottish
98.7
/100
|
#75
Exceptional
87.7%
Immigrants from Serbia
98.7
/100
|
#76
Exceptional
87.7%
Slavs
98.7
/100
|
#77
Exceptional
87.7%
Irish
98.6
/100
|
#78
Exceptional
87.6%
English
98.6
/100
|
#79
Exceptional
87.6%

Immigrants from Moldova GED/Equivalency Correlation Summary

MeasurementImmigrants from Moldova DataGED/Equivalency Data
Minimum0.026%72.0%
Maximum13.7%100.0%
Range13.6%28.0%
Mean2.3%87.6%
Median1.5%88.8%
Interquartile 25% (IQ1)0.75%84.9%
Interquartile 75% (IQ3)2.5%91.7%
Interquartile Range (IQR)1.7%6.8%
Standard Deviation (Sample)2.8%6.7%
Standard Deviation (Population)2.7%6.6%

Correlation Details

Immigrants from Moldova PercentileSample SizeGED/Equivalency
[
0.0%
-
0.5%
]
0.026%
92,797,93185.2%
[
0.0%
-
0.5%
]
0.098%
15,303,73189.8%
[
0.0%
-
0.5%
]
0.17%
5,603,66488.4%
[
0.0%
-
0.5%
]
0.24%
3,433,08387.3%
[
0.0%
-
0.5%
]
0.31%
2,217,58289.6%
[
0.0%
-
0.5%
]
0.37%
861,41590.7%
[
0.0%
-
0.5%
]
0.45%
1,064,41186.8%
[
0.5%
-
1.0%
]
0.52%
444,02688.1%
[
0.5%
-
1.0%
]
0.59%
471,46389.0%
[
0.5%
-
1.0%
]
0.66%
297,25988.8%
[
0.5%
-
1.0%
]
0.71%
300,12585.0%
[
0.5%
-
1.0%
]
0.79%
268,97189.6%
[
0.5%
-
1.0%
]
0.85%
132,70791.5%
[
0.5%
-
1.0%
]
0.93%
173,01991.5%
[
0.5%
-
1.0%
]
1.00%
223,20189.1%
[
1.0%
-
1.5%
]
1.07%
45,05492.2%
[
1.0%
-
1.5%
]
1.14%
87,69984.7%
[
1.0%
-
1.5%
]
1.20%
47,93490.2%
[
1.0%
-
1.5%
]
1.28%
132,62480.5%
[
1.0%
-
1.5%
]
1.33%
25,77992.1%
[
1.0%
-
1.5%
]
1.39%
72,60184.8%
[
1.0%
-
1.5%
]
1.49%
47092.9%
[
1.5%
-
2.0%
]
1.54%
184,78288.5%
[
1.5%
-
2.0%
]
1.59%
129,85087.1%
[
1.5%
-
2.0%
]
1.67%
6,00489.2%
[
1.5%
-
2.0%
]
1.74%
17,52692.2%
[
1.5%
-
2.0%
]
1.80%
3,62092.5%
[
1.5%
-
2.0%
]
1.94%
21,34385.5%
[
1.5%
-
2.0%
]
1.98%
1,00984.4%
[
2.0%
-
2.5%
]
2.09%
2,58384.0%
[
2.0%
-
2.5%
]
2.19%
7,21872.1%
[
2.0%
-
2.5%
]
2.26%
2,56875.6%
[
2.0%
-
2.5%
]
2.43%
37074.2%
[
2.5%
-
3.0%
]
2.51%
95673.1%
[
2.5%
-
3.0%
]
2.72%
4,92685.5%
[
2.5%
-
3.0%
]
2.81%
2,63191.9%
[
2.5%
-
3.0%
]
2.94%
68080.2%
[
3.0%
-
3.5%
]
3.26%
1,65872.0%
[
3.5%
-
4.0%
]
3.61%
388100.0%
[
3.5%
-
4.0%
]
3.71%
2,64495.3%
[
7.5%
-
8.0%
]
7.97%
2,56098.9%
[
9.0%
-
9.5%
]
9.30%
1,99088.8%
[
9.5%
-
10.0%
]
9.88%
64897.3%
[
13.5%
-
14.0%
]
13.66%
36697.1%