Immigrants from Moldova Married-Couple Family Poverty

COMPARE

Immigrants from Moldova
Race
Ancestry
AfghanAfricanAlaska NativeAlaskan AthabascanAlbanianAleutAlsatianAmericanApacheArabArapahoArgentineanArmenianAssyrian/Chaldean/SyriacAustralianAustrianBahamianBangladeshiBarbadianBasqueBelgianBelizeanBermudanBhutaneseBlackfeetBolivianBrazilianBritishBritish West IndianBulgarianBurmeseCajunCambodianCanadianCape VerdeanCarpatho RusynCelticCentral AmericanCentral American IndianCherokeeCheyenneChickasawChileanChineseChippewaChoctawColombianColvilleComancheCosta RicanCreeCreekCroatianCrowCubanCypriotCzechCzechoslovakianDanishDelawareDominicanDutchDutch West IndianEastern EuropeanEcuadorianEgyptianEnglishEstonianEthiopianEuropeanFijianFilipinoFinnishFrenchFrench American IndianFrench CanadianGermanGerman RussianGhanaianGreekGuamanian/ChamorroGuatemalanGuyaneseHaitianHmongHonduranHopiHoumaHungarianIcelanderIndian (Asian)IndonesianInupiatIranianIraqiIrishIroquoisIsraeliItalianJamaicanJapaneseJordanianKenyanKiowaKoreanLaotianLatvianLebaneseLiberianLithuanianLumbeeLuxembourgerMacedonianMalaysianMalteseMarshalleseMenomineeMexicanMexican American IndianMongolianMoroccanNative HawaiianNavajoNepaleseNew ZealanderNicaraguanNigerianNorthern EuropeanNorwegianOkinawanOsageOttawaPaiutePakistaniPalestinianPanamanianParaguayanPennsylvania GermanPeruvianPimaPolishPortuguesePotawatomiPuebloPuerto RicanPuget Sound SalishRomanianRussianSalvadoranSamoanScandinavianScotch-IrishScottishSeminoleSenegaleseSerbianShoshoneSierra LeoneanSiouxSlavicSlovakSloveneSomaliSouth AfricanSouth AmericanSouth American IndianSoviet UnionSpaniardSpanishSpanish AmericanSpanish American IndianSri LankanSubsaharan AfricanSudaneseSwedishSwissSyrianTaiwaneseThaiTlingit-HaidaTohono O'OdhamTonganTrinidadian and TobagonianTsimshianTurkishU.S. Virgin IslanderUgandanUkrainianUruguayanUteVenezuelanVietnameseWelshWest IndianYakamaYaquiYugoslavianYumanYup'ikZimbabwean
Immigration
NonimmigrantsImmigrantsAfghanistanAfricaAlbaniaArgentinaArmeniaAsiaAustraliaAustriaBahamasBangladeshBarbadosBelarusBelgiumBelizeBoliviaBosnia and HerzegovinaBrazilBulgariaBurma/MyanmarCabo VerdeCambodiaCameroonCanadaCaribbeanCentral AmericaChileChinaColombiaCongoCosta RicaCroatiaCubaCzechoslovakiaDenmarkDominicaDominican RepublicEastern AfricaEastern AsiaEastern EuropeEcuadorEgyptEl SalvadorEnglandEritreaEthiopiaEuropeFijiFranceGermanyGhanaGreeceGrenadaGuatemalaGuyanaHaitiHondurasHong KongHungaryIndiaIndonesiaIranIraqIrelandIsraelItalyJamaicaJapanJordanKazakhstanKenyaKoreaKuwaitLaosLatin AmericaLatviaLebanonLiberiaLithuaniaMalaysiaMexicoMicronesiaMiddle AfricaMoldovaMoroccoNepalNetherlandsNicaraguaNigeriaNorth AmericaNorth MacedoniaNorthern AfricaNorthern EuropeNorwayOceaniaPakistanPanamaPeruPhilippinesPolandPortugalRomaniaRussiaSaudi ArabiaScotlandSenegalSerbiaSierra LeoneSingaporeSomaliaSouth AfricaSouth AmericaSouth Central AsiaSouth Eastern AsiaSouthern EuropeSpainSri LankaSt. Vincent and the GrenadinesSudanSwedenSwitzerlandSyriaTaiwanThailandTrinidad and TobagoTurkeyUgandaUkraineUruguayUzbekistanVenezuelaVietnamWest IndiesWestern AfricaWestern AsiaWestern EuropeYemenZaireZimbabweAzores
Select to Compare
Race
Ancestry
AfghanAfricanAlaska NativeAlaskan AthabascanAlbanianAleutAlsatianAmericanApacheArabArapahoArgentineanArmenianAssyrian/Chaldean/SyriacAustralianAustrianBahamianBangladeshiBarbadianBasqueBelgianBelizeanBermudanBhutaneseBlackfeetBolivianBrazilianBritishBritish West IndianBulgarianBurmeseCajunCambodianCanadianCape VerdeanCarpatho RusynCelticCentral AmericanCentral American IndianCherokeeCheyenneChickasawChileanChineseChippewaChoctawColombianColvilleComancheCosta RicanCreeCreekCroatianCrowCubanCypriotCzechCzechoslovakianDanishDelawareDominicanDutchDutch West IndianEastern EuropeanEcuadorianEgyptianEnglishEstonianEthiopianEuropeanFijianFilipinoFinnishFrenchFrench American IndianFrench CanadianGermanGerman RussianGhanaianGreekGuamanian/ChamorroGuatemalanGuyaneseHaitianHmongHonduranHopiHoumaHungarianIcelanderIndian (Asian)IndonesianInupiatIranianIraqiIrishIroquoisIsraeliItalianJamaicanJapaneseJordanianKenyanKiowaKoreanLaotianLatvianLebaneseLiberianLithuanianLumbeeLuxembourgerMacedonianMalaysianMalteseMarshalleseMenomineeMexicanMexican American IndianMongolianMoroccanNative HawaiianNavajoNepaleseNew ZealanderNicaraguanNigerianNorthern EuropeanNorwegianOkinawanOsageOttawaPaiutePakistaniPalestinianPanamanianParaguayanPennsylvania GermanPeruvianPimaPolishPortuguesePotawatomiPuebloPuerto RicanPuget Sound SalishRomanianRussianSalvadoranSamoanScandinavianScotch-IrishScottishSeminoleSenegaleseSerbianShoshoneSierra LeoneanSiouxSlavicSlovakSloveneSomaliSouth AfricanSouth AmericanSouth American IndianSoviet UnionSpaniardSpanishSpanish AmericanSpanish American IndianSri LankanSubsaharan AfricanSudaneseSwedishSwissSyrianTaiwaneseThaiTlingit-HaidaTohono O'OdhamTonganTrinidadian and TobagonianTsimshianTurkishU.S. Virgin IslanderUgandanUkrainianUruguayanUteVenezuelanVietnameseWelshWest IndianYakamaYaquiYugoslavianYumanYup'ikZimbabwean
Immigration
NonimmigrantsImmigrantsAfghanistanAfricaAlbaniaArgentinaArmeniaAsiaAustraliaAustriaBahamasBangladeshBarbadosBelarusBelgiumBelizeBoliviaBosnia and HerzegovinaBrazilBulgariaBurma/MyanmarCabo VerdeCambodiaCameroonCanadaCaribbeanCentral AmericaChileChinaColombiaCongoCosta RicaCroatiaCubaCzechoslovakiaDenmarkDominicaDominican RepublicEastern AfricaEastern AsiaEastern EuropeEcuadorEgyptEl SalvadorEnglandEritreaEthiopiaEuropeFijiFranceGermanyGhanaGreeceGrenadaGuatemalaGuyanaHaitiHondurasHong KongHungaryIndiaIndonesiaIranIraqIrelandIsraelItalyJamaicaJapanJordanKazakhstanKenyaKoreaKuwaitLaosLatin AmericaLatviaLebanonLiberiaLithuaniaMalaysiaMexicoMicronesiaMiddle AfricaMoroccoNepalNetherlandsNicaraguaNigeriaNorth AmericaNorth MacedoniaNorthern AfricaNorthern EuropeNorwayOceaniaPakistanPanamaPeruPhilippinesPolandPortugalRomaniaRussiaSaudi ArabiaScotlandSenegalSerbiaSierra LeoneSingaporeSomaliaSouth AfricaSouth AmericaSouth Central AsiaSouth Eastern AsiaSouthern EuropeSpainSri LankaSt. Vincent and the GrenadinesSudanSwedenSwitzerlandSyriaTaiwanThailandTrinidad and TobagoTurkeyUgandaUkraineUruguayUzbekistanVenezuelaVietnamWest IndiesWestern AfricaWestern AsiaWestern EuropeYemenZaireZimbabweAzores
Married-Couple Family Poverty
Income
Poverty
Unemployment
Labor Participation
Family Structure
Vehicle Availability
Education Level
Disability

Immigrants from Moldova Married-Couple Family Poverty
Exceptional

4.7%
POVERTY | MARRIED-COUPLE FAMILIES
97.1/ 100
METRIC RATING
104th/ 347
METRIC RANK

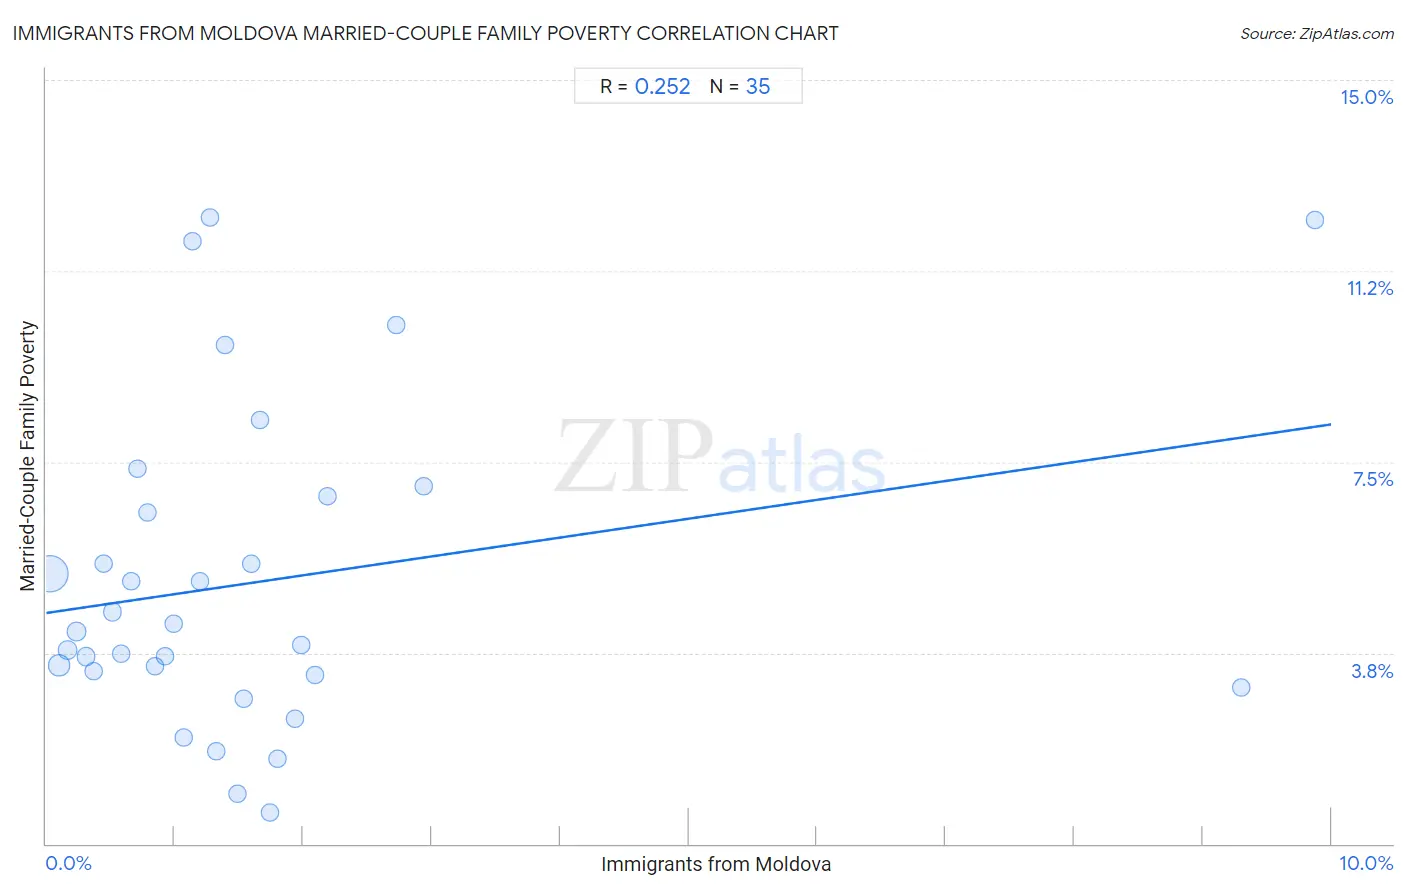
Immigrants from Moldova Married-Couple Family Poverty Correlation Chart

The statistical analysis conducted on geographies consisting of 124,083,541 people shows a weak positive correlation between the proportion of Immigrants from Moldova and poverty level among married-couple families in the United States with a correlation coefficient (R) of 0.252 and weighted average of 4.7%. On average, for every 1% (one percent) increase in Immigrants from Moldova within a typical geography, there is an increase of 0.37% in poverty level among married-couple families.
Immigrants from Moldova Married-Couple Family Poverty
It is essential to understand that the correlation between the percentage of Immigrants from Moldova and poverty level among married-couple families does not imply a direct cause-and-effect relationship. It remains uncertain whether the presence of Immigrants from Moldova influences an upward or downward trend in the level of poverty level among married-couple families within an area, or if Immigrants from Moldova simply ended up residing in those areas with higher or lower levels of poverty level among married-couple families due to other factors.

Demographics Similar to Immigrants from Moldova by Married-Couple Family Poverty

In terms of married-couple family poverty, the demographic groups most similar to Immigrants from Moldova are Aleut (4.7%, a difference of 0.070%), Immigrants from France (4.7%, a difference of 0.23%), Immigrants from Germany (4.7%, a difference of 0.24%), Immigrants from Romania (4.7%, a difference of 0.34%), and Laotian (4.7%, a difference of 0.50%).
DemographicsRating | RankMarried-Couple Family Poverty
Immigrants from Belgium
98.2
/100
|
#97
Exceptional
4.6%
Native Hawaiians
98.0
/100
|
#98
Exceptional
4.6%
Immigrants from Europe
97.9
/100
|
#99
Exceptional
4.6%
Immigrants from Western Europe
97.9
/100
|
#100
Exceptional
4.6%
Yugoslavians
97.8
/100
|
#101
Exceptional
4.6%
Asians
97.6
/100
|
#102
Exceptional
4.7%
Immigrants from Romania
97.3
/100
|
#103
Exceptional
4.7%
Immigrants from Moldova
97.1
/100
|
#104
Exceptional
4.7%
Aleuts
97.0
/100
|
#105
Exceptional
4.7%
Immigrants from France
96.9
/100
|
#106
Exceptional
4.7%
Immigrants from Germany
96.8
/100
|
#107
Exceptional
4.7%
Laotians
96.6
/100
|
#108
Exceptional
4.7%
Immigrants from Hong Kong
96.4
/100
|
#109
Exceptional
4.7%
Immigrants from Bolivia
96.2
/100
|
#110
Exceptional
4.7%
Pakistanis
96.2
/100
|
#111
Exceptional
4.7%

Immigrants from Moldova Married-Couple Family Poverty Correlation Summary

MeasurementImmigrants from Moldova DataMarried-Couple Family Poverty Data
Minimum0.026%0.62%
Maximum9.9%12.3%
Range9.9%11.7%
Mean1.7%5.1%
Median1.2%4.2%
Interquartile 25% (IQ1)0.59%3.3%
Interquartile 75% (IQ3)1.8%6.8%
Interquartile Range (IQR)1.2%3.5%
Standard Deviation (Sample)2.1%3.1%
Standard Deviation (Population)2.1%3.1%

Correlation Details

Immigrants from Moldova PercentileSample SizeMarried-Couple Family Poverty
[
0.0%
-
0.5%
]
0.026%
92,775,2815.3%
[
0.0%
-
0.5%
]
0.098%
15,248,8323.5%
[
0.0%
-
0.5%
]
0.17%
5,557,5413.8%
[
0.0%
-
0.5%
]
0.24%
3,358,3284.2%
[
0.0%
-
0.5%
]
0.31%
2,204,9813.7%
[
0.0%
-
0.5%
]
0.37%
834,7763.4%
[
0.0%
-
0.5%
]
0.45%
1,061,3925.5%
[
0.5%
-
1.0%
]
0.52%
434,6534.6%
[
0.5%
-
1.0%
]
0.59%
466,2953.7%
[
0.5%
-
1.0%
]
0.66%
290,0405.1%
[
0.5%
-
1.0%
]
0.71%
294,6477.4%
[
0.5%
-
1.0%
]
0.79%
260,6706.5%
[
0.5%
-
1.0%
]
0.85%
128,4393.5%
[
0.5%
-
1.0%
]
0.93%
173,0193.7%
[
0.5%
-
1.0%
]
1.00%
216,4334.3%
[
1.0%
-
1.5%
]
1.07%
45,0542.1%
[
1.0%
-
1.5%
]
1.14%
87,69911.8%
[
1.0%
-
1.5%
]
1.20%
39,0855.2%
[
1.0%
-
1.5%
]
1.28%
132,62412.3%
[
1.0%
-
1.5%
]
1.32%
21,0051.8%
[
1.0%
-
1.5%
]
1.39%
72,6019.8%
[
1.0%
-
1.5%
]
1.49%
4700.98%
[
1.5%
-
2.0%
]
1.54%
184,7822.8%
[
1.5%
-
2.0%
]
1.59%
129,8505.5%
[
1.5%
-
2.0%
]
1.66%
4,6268.3%
[
1.5%
-
2.0%
]
1.74%
16,6600.62%
[
1.5%
-
2.0%
]
1.80%
3,6201.7%
[
1.5%
-
2.0%
]
1.94%
21,0842.5%
[
1.5%
-
2.0%
]
1.98%
1,0093.9%
[
2.0%
-
2.5%
]
2.09%
2,5833.3%
[
2.0%
-
2.5%
]
2.19%
7,2186.8%
[
2.5%
-
3.0%
]
2.72%
4,92610.2%
[
2.5%
-
3.0%
]
2.94%
6807.0%
[
9.0%
-
9.5%
]
9.30%
1,9903.1%
[
9.5%
-
10.0%
]
9.88%
64812.2%