Immigrants from Moldova Married-couple Households

COMPARE

Immigrants from Moldova
Race
Ancestry
AfghanAfricanAlaska NativeAlaskan AthabascanAlbanianAleutAlsatianAmericanApacheArabArapahoArgentineanArmenianAssyrian/Chaldean/SyriacAustralianAustrianBahamianBangladeshiBarbadianBasqueBelgianBelizeanBermudanBhutaneseBlackfeetBolivianBrazilianBritishBritish West IndianBulgarianBurmeseCajunCambodianCanadianCape VerdeanCarpatho RusynCelticCentral AmericanCentral American IndianCherokeeCheyenneChickasawChileanChineseChippewaChoctawColombianColvilleComancheCosta RicanCreeCreekCroatianCrowCubanCypriotCzechCzechoslovakianDanishDelawareDominicanDutchDutch West IndianEastern EuropeanEcuadorianEgyptianEnglishEstonianEthiopianEuropeanFijianFilipinoFinnishFrenchFrench American IndianFrench CanadianGermanGerman RussianGhanaianGreekGuamanian/ChamorroGuatemalanGuyaneseHaitianHmongHonduranHopiHoumaHungarianIcelanderIndian (Asian)IndonesianInupiatIranianIraqiIrishIroquoisIsraeliItalianJamaicanJapaneseJordanianKenyanKiowaKoreanLaotianLatvianLebaneseLiberianLithuanianLumbeeLuxembourgerMacedonianMalaysianMalteseMarshalleseMenomineeMexicanMexican American IndianMongolianMoroccanNative HawaiianNavajoNepaleseNew ZealanderNicaraguanNigerianNorthern EuropeanNorwegianOkinawanOsageOttawaPaiutePakistaniPalestinianPanamanianParaguayanPennsylvania GermanPeruvianPimaPolishPortuguesePotawatomiPuebloPuerto RicanPuget Sound SalishRomanianRussianSalvadoranSamoanScandinavianScotch-IrishScottishSeminoleSenegaleseSerbianShoshoneSierra LeoneanSiouxSlavicSlovakSloveneSomaliSouth AfricanSouth AmericanSouth American IndianSoviet UnionSpaniardSpanishSpanish AmericanSpanish American IndianSri LankanSubsaharan AfricanSudaneseSwedishSwissSyrianTaiwaneseThaiTlingit-HaidaTohono O'OdhamTonganTrinidadian and TobagonianTsimshianTurkishU.S. Virgin IslanderUgandanUkrainianUruguayanUteVenezuelanVietnameseWelshWest IndianYakamaYaquiYugoslavianYumanYup'ikZimbabwean
Immigration
NonimmigrantsImmigrantsAfghanistanAfricaAlbaniaArgentinaArmeniaAsiaAustraliaAustriaBahamasBangladeshBarbadosBelarusBelgiumBelizeBoliviaBosnia and HerzegovinaBrazilBulgariaBurma/MyanmarCabo VerdeCambodiaCameroonCanadaCaribbeanCentral AmericaChileChinaColombiaCongoCosta RicaCroatiaCubaCzechoslovakiaDenmarkDominicaDominican RepublicEastern AfricaEastern AsiaEastern EuropeEcuadorEgyptEl SalvadorEnglandEritreaEthiopiaEuropeFijiFranceGermanyGhanaGreeceGrenadaGuatemalaGuyanaHaitiHondurasHong KongHungaryIndiaIndonesiaIranIraqIrelandIsraelItalyJamaicaJapanJordanKazakhstanKenyaKoreaKuwaitLaosLatin AmericaLatviaLebanonLiberiaLithuaniaMalaysiaMexicoMicronesiaMiddle AfricaMoldovaMoroccoNepalNetherlandsNicaraguaNigeriaNorth AmericaNorth MacedoniaNorthern AfricaNorthern EuropeNorwayOceaniaPakistanPanamaPeruPhilippinesPolandPortugalRomaniaRussiaSaudi ArabiaScotlandSenegalSerbiaSierra LeoneSingaporeSomaliaSouth AfricaSouth AmericaSouth Central AsiaSouth Eastern AsiaSouthern EuropeSpainSri LankaSt. Vincent and the GrenadinesSudanSwedenSwitzerlandSyriaTaiwanThailandTrinidad and TobagoTurkeyUgandaUkraineUruguayUzbekistanVenezuelaVietnamWest IndiesWestern AfricaWestern AsiaWestern EuropeYemenZaireZimbabweAzores
Select to Compare
Race
Ancestry
AfghanAfricanAlaska NativeAlaskan AthabascanAlbanianAleutAlsatianAmericanApacheArabArapahoArgentineanArmenianAssyrian/Chaldean/SyriacAustralianAustrianBahamianBangladeshiBarbadianBasqueBelgianBelizeanBermudanBhutaneseBlackfeetBolivianBrazilianBritishBritish West IndianBulgarianBurmeseCajunCambodianCanadianCape VerdeanCarpatho RusynCelticCentral AmericanCentral American IndianCherokeeCheyenneChickasawChileanChineseChippewaChoctawColombianColvilleComancheCosta RicanCreeCreekCroatianCrowCubanCypriotCzechCzechoslovakianDanishDelawareDominicanDutchDutch West IndianEastern EuropeanEcuadorianEgyptianEnglishEstonianEthiopianEuropeanFijianFilipinoFinnishFrenchFrench American IndianFrench CanadianGermanGerman RussianGhanaianGreekGuamanian/ChamorroGuatemalanGuyaneseHaitianHmongHonduranHopiHoumaHungarianIcelanderIndian (Asian)IndonesianInupiatIranianIraqiIrishIroquoisIsraeliItalianJamaicanJapaneseJordanianKenyanKiowaKoreanLaotianLatvianLebaneseLiberianLithuanianLumbeeLuxembourgerMacedonianMalaysianMalteseMarshalleseMenomineeMexicanMexican American IndianMongolianMoroccanNative HawaiianNavajoNepaleseNew ZealanderNicaraguanNigerianNorthern EuropeanNorwegianOkinawanOsageOttawaPaiutePakistaniPalestinianPanamanianParaguayanPennsylvania GermanPeruvianPimaPolishPortuguesePotawatomiPuebloPuerto RicanPuget Sound SalishRomanianRussianSalvadoranSamoanScandinavianScotch-IrishScottishSeminoleSenegaleseSerbianShoshoneSierra LeoneanSiouxSlavicSlovakSloveneSomaliSouth AfricanSouth AmericanSouth American IndianSoviet UnionSpaniardSpanishSpanish AmericanSpanish American IndianSri LankanSubsaharan AfricanSudaneseSwedishSwissSyrianTaiwaneseThaiTlingit-HaidaTohono O'OdhamTonganTrinidadian and TobagonianTsimshianTurkishU.S. Virgin IslanderUgandanUkrainianUruguayanUteVenezuelanVietnameseWelshWest IndianYakamaYaquiYugoslavianYumanYup'ikZimbabwean
Immigration
NonimmigrantsImmigrantsAfghanistanAfricaAlbaniaArgentinaArmeniaAsiaAustraliaAustriaBahamasBangladeshBarbadosBelarusBelgiumBelizeBoliviaBosnia and HerzegovinaBrazilBulgariaBurma/MyanmarCabo VerdeCambodiaCameroonCanadaCaribbeanCentral AmericaChileChinaColombiaCongoCosta RicaCroatiaCubaCzechoslovakiaDenmarkDominicaDominican RepublicEastern AfricaEastern AsiaEastern EuropeEcuadorEgyptEl SalvadorEnglandEritreaEthiopiaEuropeFijiFranceGermanyGhanaGreeceGrenadaGuatemalaGuyanaHaitiHondurasHong KongHungaryIndiaIndonesiaIranIraqIrelandIsraelItalyJamaicaJapanJordanKazakhstanKenyaKoreaKuwaitLaosLatin AmericaLatviaLebanonLiberiaLithuaniaMalaysiaMexicoMicronesiaMiddle AfricaMoroccoNepalNetherlandsNicaraguaNigeriaNorth AmericaNorth MacedoniaNorthern AfricaNorthern EuropeNorwayOceaniaPakistanPanamaPeruPhilippinesPolandPortugalRomaniaRussiaSaudi ArabiaScotlandSenegalSerbiaSierra LeoneSingaporeSomaliaSouth AfricaSouth AmericaSouth Central AsiaSouth Eastern AsiaSouthern EuropeSpainSri LankaSt. Vincent and the GrenadinesSudanSwedenSwitzerlandSyriaTaiwanThailandTrinidad and TobagoTurkeyUgandaUkraineUruguayUzbekistanVenezuelaVietnamWest IndiesWestern AfricaWestern AsiaWestern EuropeYemenZaireZimbabweAzores
Married-couple Households
Income
Poverty
Unemployment
Labor Participation
Family Structure
Vehicle Availability
Education Level
Disability

Immigrants from Moldova Married-couple Households
Exceptional

48.0%
MARRIED-COUPLE HOUSEHOLDS
97.0/ 100
METRIC RATING
91st/ 347
METRIC RANK

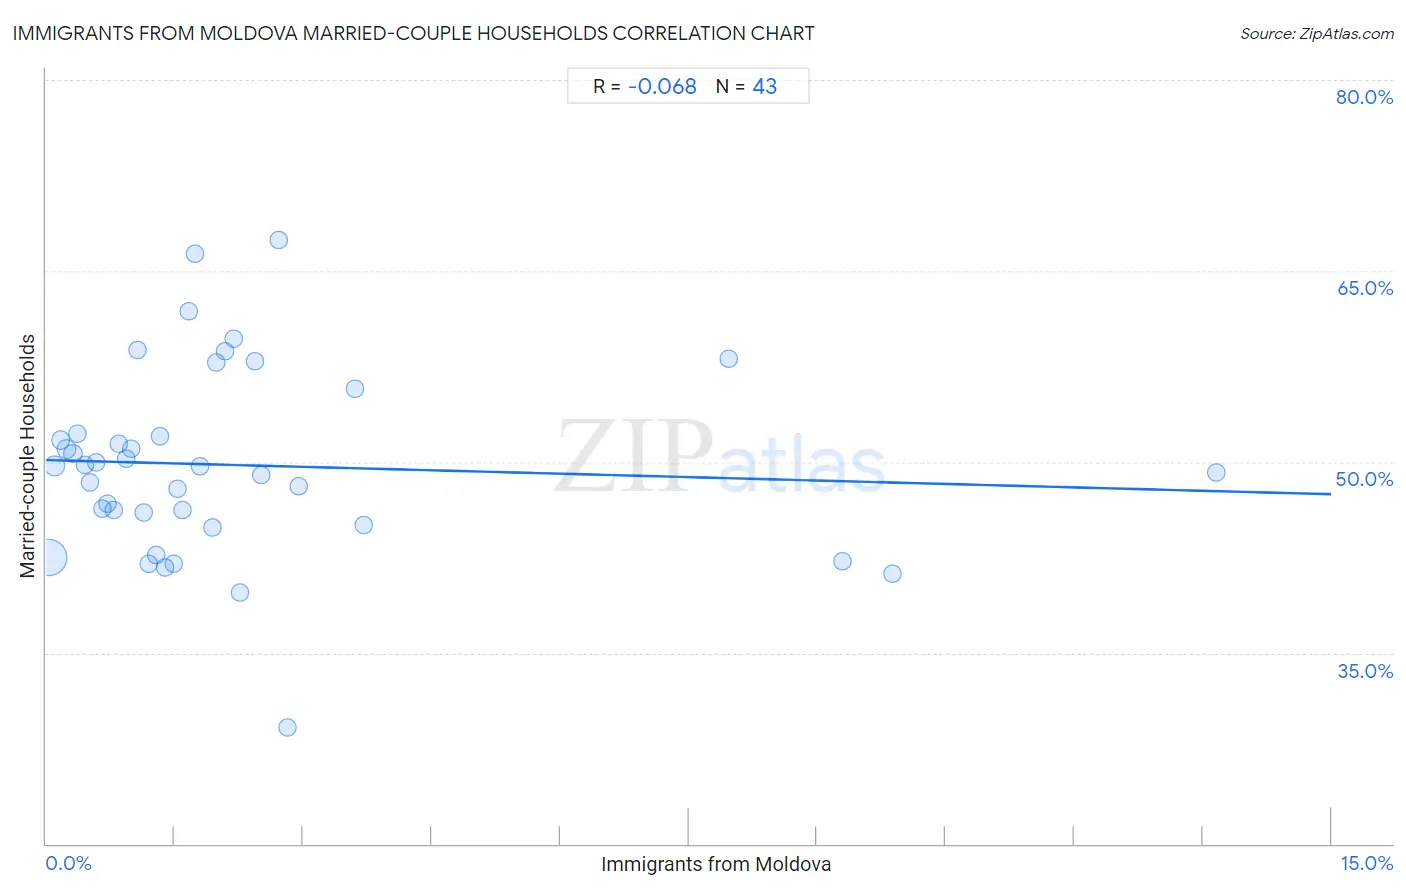
Immigrants from Moldova Married-couple Households Correlation Chart

The statistical analysis conducted on geographies consisting of 124,364,803 people shows a slight negative correlation between the proportion of Immigrants from Moldova and percentage of married-couple family households in the United States with a correlation coefficient (R) of -0.068 and weighted average of 48.0%. On average, for every 1% (one percent) increase in Immigrants from Moldova within a typical geography, there is a decrease of 0.18% in percentage of married-couple family households.
Immigrants from Moldova Married-couple Households
It is essential to understand that the correlation between the percentage of Immigrants from Moldova and percentage of married-couple family households does not imply a direct cause-and-effect relationship. It remains uncertain whether the presence of Immigrants from Moldova influences an upward or downward trend in the level of percentage of married-couple family households within an area, or if Immigrants from Moldova simply ended up residing in those areas with higher or lower levels of percentage of married-couple family households due to other factors.

Demographics Similar to Immigrants from Moldova by Married-couple Households

In terms of married-couple households, the demographic groups most similar to Immigrants from Moldova are Palestinian (48.0%, a difference of 0.020%), Lebanese (47.9%, a difference of 0.040%), American (47.9%, a difference of 0.040%), French (48.0%, a difference of 0.060%), and Immigrants from Belgium (47.9%, a difference of 0.070%).
DemographicsRating | RankMarried-couple Households
Ukrainians
97.6
/100
|
#84
Exceptional
48.1%
Immigrants from Israel
97.4
/100
|
#85
Exceptional
48.0%
Belgians
97.4
/100
|
#86
Exceptional
48.0%
Immigrants from Ireland
97.3
/100
|
#87
Exceptional
48.0%
Afghans
97.3
/100
|
#88
Exceptional
48.0%
Cypriots
97.2
/100
|
#89
Exceptional
48.0%
French
97.2
/100
|
#90
Exceptional
48.0%
Immigrants from Moldova
97.0
/100
|
#91
Exceptional
48.0%
Palestinians
96.9
/100
|
#92
Exceptional
48.0%
Lebanese
96.9
/100
|
#93
Exceptional
47.9%
Americans
96.9
/100
|
#94
Exceptional
47.9%
Immigrants from Belgium
96.8
/100
|
#95
Exceptional
47.9%
Immigrants from Egypt
96.6
/100
|
#96
Exceptional
47.9%
Latvians
96.5
/100
|
#97
Exceptional
47.9%
Immigrants from North Macedonia
96.4
/100
|
#98
Exceptional
47.9%

Immigrants from Moldova Married-couple Households Correlation Summary

MeasurementImmigrants from Moldova DataMarried-couple Households Data
Minimum0.026%29.2%
Maximum13.7%67.4%
Range13.6%38.3%
Mean2.3%49.7%
Median1.5%49.6%
Interquartile 25% (IQ1)0.71%45.0%
Interquartile 75% (IQ3)2.4%52.2%
Interquartile Range (IQR)1.7%7.2%
Standard Deviation (Sample)2.8%7.4%
Standard Deviation (Population)2.8%7.3%

Correlation Details

Immigrants from Moldova PercentileSample SizeMarried-couple Households
[
0.0%
-
0.5%
]
0.026%
92,797,93142.5%
[
0.0%
-
0.5%
]
0.098%
15,279,10649.7%
[
0.0%
-
0.5%
]
0.17%
5,599,16051.7%
[
0.0%
-
0.5%
]
0.24%
3,433,08351.0%
[
0.0%
-
0.5%
]
0.31%
2,217,58250.7%
[
0.0%
-
0.5%
]
0.37%
859,21452.2%
[
0.0%
-
0.5%
]
0.45%
1,061,39249.8%
[
0.5%
-
1.0%
]
0.52%
444,02648.4%
[
0.5%
-
1.0%
]
0.59%
471,46349.9%
[
0.5%
-
1.0%
]
0.66%
297,25946.3%
[
0.5%
-
1.0%
]
0.71%
300,12546.8%
[
0.5%
-
1.0%
]
0.79%
268,97146.2%
[
0.5%
-
1.0%
]
0.85%
132,70751.4%
[
0.5%
-
1.0%
]
0.93%
173,01950.2%
[
0.5%
-
1.0%
]
1.00%
223,20151.0%
[
1.0%
-
1.5%
]
1.07%
45,05458.8%
[
1.0%
-
1.5%
]
1.14%
87,69946.1%
[
1.0%
-
1.5%
]
1.20%
47,93442.0%
[
1.0%
-
1.5%
]
1.28%
132,62442.7%
[
1.0%
-
1.5%
]
1.33%
25,77952.1%
[
1.0%
-
1.5%
]
1.39%
72,60141.7%
[
1.0%
-
1.5%
]
1.49%
47042.0%
[
1.5%
-
2.0%
]
1.54%
184,78247.9%
[
1.5%
-
2.0%
]
1.59%
129,85046.2%
[
1.5%
-
2.0%
]
1.67%
6,00461.9%
[
1.5%
-
2.0%
]
1.74%
17,52666.4%
[
1.5%
-
2.0%
]
1.80%
3,62049.6%
[
1.5%
-
2.0%
]
1.94%
21,08444.9%
[
1.5%
-
2.0%
]
1.98%
1,00957.8%
[
2.0%
-
2.5%
]
2.09%
2,58358.7%
[
2.0%
-
2.5%
]
2.19%
7,21859.7%
[
2.0%
-
2.5%
]
2.26%
2,56839.7%
[
2.0%
-
2.5%
]
2.43%
37057.9%
[
2.5%
-
3.0%
]
2.51%
95648.9%
[
2.5%
-
3.0%
]
2.72%
4,92667.4%
[
2.5%
-
3.0%
]
2.81%
2,63129.2%
[
2.5%
-
3.0%
]
2.94%
68048.1%
[
3.5%
-
4.0%
]
3.61%
38855.8%
[
3.5%
-
4.0%
]
3.71%
2,64445.0%
[
7.5%
-
8.0%
]
7.97%
2,56058.1%
[
9.0%
-
9.5%
]
9.30%
1,99042.2%
[
9.5%
-
10.0%
]
9.88%
64841.2%
[
13.5%
-
14.0%
]
13.66%
36649.2%