Immigrants from Middle Africa Married-couple Households
COMPARE
Immigrants from Middle Africa
Select to Compare
Married-couple Households
Immigrants from Middle Africa Married-couple Households
41.8%
MARRIED-COUPLE HOUSEHOLDS
0.0/ 100
METRIC RATING
298th/ 347
METRIC RANK
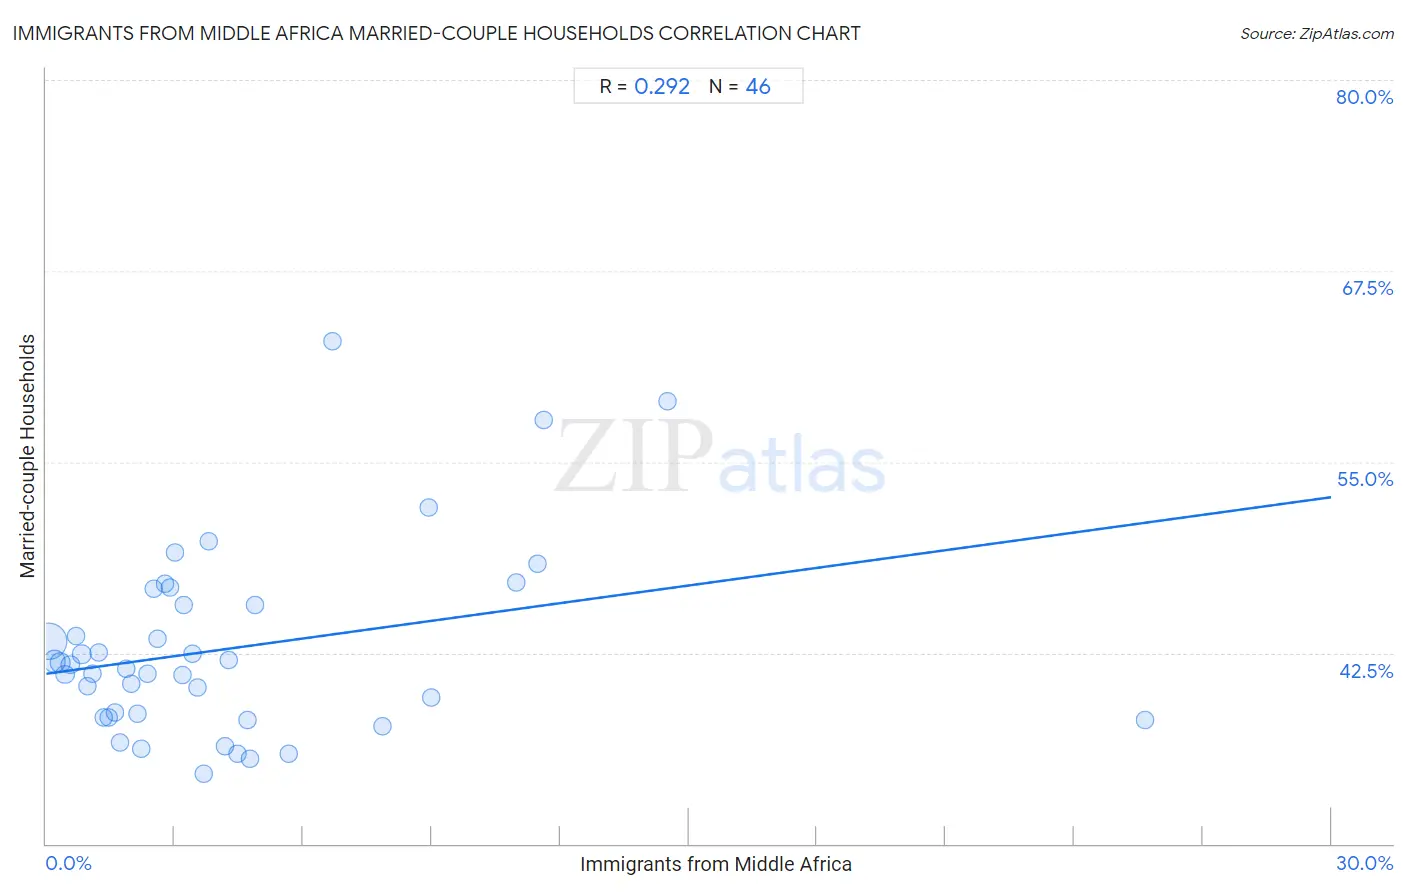
Immigrants from Middle Africa Married-couple Households Correlation Chart
The statistical analysis conducted on geographies consisting of 202,654,857 people shows a weak positive correlation between the proportion of Immigrants from Middle Africa and percentage of married-couple family households in the United States with a correlation coefficient (R) of 0.292 and weighted average of 41.8%. On average, for every 1% (one percent) increase in Immigrants from Middle Africa within a typical geography, there is an increase of 0.39% in percentage of married-couple family households.
It is essential to understand that the correlation between the percentage of Immigrants from Middle Africa and percentage of married-couple family households does not imply a direct cause-and-effect relationship. It remains uncertain whether the presence of Immigrants from Middle Africa influences an upward or downward trend in the level of percentage of married-couple family households within an area, or if Immigrants from Middle Africa simply ended up residing in those areas with higher or lower levels of percentage of married-couple family households due to other factors.
Demographics Similar to Immigrants from Middle Africa by Married-couple Households
In terms of married-couple households, the demographic groups most similar to Immigrants from Middle Africa are Arapaho (41.8%, a difference of 0.040%), Immigrants from Ghana (41.8%, a difference of 0.080%), Immigrants from Belize (41.8%, a difference of 0.090%), Immigrants from Bahamas (41.7%, a difference of 0.30%), and Immigrants from Sudan (41.9%, a difference of 0.33%).
| Demographics | Rating | Rank | Married-couple Households |
| Paiute | 0.0 /100 | #291 | Tragic 42.1% |
| Indonesians | 0.0 /100 | #292 | Tragic 42.0% |
| Menominee | 0.0 /100 | #293 | Tragic 42.0% |
| Immigrants from Yemen | 0.0 /100 | #294 | Tragic 42.0% |
| Kiowa | 0.0 /100 | #295 | Tragic 42.0% |
| Immigrants from Sudan | 0.0 /100 | #296 | Tragic 41.9% |
| Arapaho | 0.0 /100 | #297 | Tragic 41.8% |
| Immigrants from Middle Africa | 0.0 /100 | #298 | Tragic 41.8% |
| Immigrants from Ghana | 0.0 /100 | #299 | Tragic 41.8% |
| Immigrants from Belize | 0.0 /100 | #300 | Tragic 41.8% |
| Immigrants from Bahamas | 0.0 /100 | #301 | Tragic 41.7% |
| Immigrants from Honduras | 0.0 /100 | #302 | Tragic 41.6% |
| Sub-Saharan Africans | 0.0 /100 | #303 | Tragic 41.6% |
| Immigrants from Guyana | 0.0 /100 | #304 | Tragic 41.6% |
| Sioux | 0.0 /100 | #305 | Tragic 41.5% |
Immigrants from Middle Africa Married-couple Households Correlation Summary
| Measurement | Immigrants from Middle Africa Data | Married-couple Households Data |
| Minimum | 0.047% | 34.6% |
| Maximum | 25.6% | 62.9% |
| Range | 25.6% | 28.4% |
| Mean | 4.3% | 42.8% |
| Median | 3.0% | 41.6% |
| Interquartile 25% (IQ1) | 1.5% | 38.3% |
| Interquartile 75% (IQ3) | 4.8% | 45.6% |
| Interquartile Range (IQR) | 3.3% | 7.4% |
| Standard Deviation (Sample) | 4.7% | 6.2% |
| Standard Deviation (Population) | 4.6% | 6.1% |
Correlation Details
| Immigrants from Middle Africa Percentile | Sample Size | Married-couple Households |
[ 0.0% - 0.5% ] 0.047% | 132,025,251 | 43.3% |
[ 0.0% - 0.5% ] 0.19% | 33,274,626 | 42.0% |
[ 0.0% - 0.5% ] 0.32% | 15,092,198 | 41.9% |
[ 0.0% - 0.5% ] 0.43% | 7,461,029 | 41.1% |
[ 0.5% - 1.0% ] 0.57% | 4,568,995 | 41.7% |
[ 0.5% - 1.0% ] 0.70% | 2,671,285 | 43.6% |
[ 0.5% - 1.0% ] 0.83% | 1,571,316 | 42.4% |
[ 0.5% - 1.0% ] 0.96% | 959,157 | 40.3% |
[ 1.0% - 1.5% ] 1.08% | 946,046 | 41.1% |
[ 1.0% - 1.5% ] 1.21% | 887,361 | 42.5% |
[ 1.0% - 1.5% ] 1.34% | 620,695 | 38.2% |
[ 1.0% - 1.5% ] 1.45% | 280,199 | 38.3% |
[ 1.5% - 2.0% ] 1.62% | 227,605 | 38.6% |
[ 1.5% - 2.0% ] 1.73% | 294,666 | 36.6% |
[ 1.5% - 2.0% ] 1.86% | 294,753 | 41.5% |
[ 1.5% - 2.0% ] 1.98% | 178,803 | 40.5% |
[ 2.0% - 2.5% ] 2.14% | 122,311 | 38.5% |
[ 2.0% - 2.5% ] 2.23% | 153,287 | 36.2% |
[ 2.0% - 2.5% ] 2.37% | 199,553 | 41.1% |
[ 2.0% - 2.5% ] 2.50% | 127,033 | 46.7% |
[ 2.5% - 3.0% ] 2.60% | 12,365 | 43.4% |
[ 2.5% - 3.0% ] 2.77% | 10,210 | 47.0% |
[ 2.5% - 3.0% ] 2.90% | 105,607 | 46.8% |
[ 3.0% - 3.5% ] 3.02% | 49,856 | 49.1% |
[ 3.0% - 3.5% ] 3.17% | 20,174 | 41.1% |
[ 3.0% - 3.5% ] 3.21% | 3,648 | 45.6% |
[ 3.0% - 3.5% ] 3.40% | 43,554 | 42.4% |
[ 3.5% - 4.0% ] 3.54% | 125,905 | 40.2% |
[ 3.5% - 4.0% ] 3.69% | 2,330 | 34.6% |
[ 3.5% - 4.0% ] 3.79% | 12,128 | 49.8% |
[ 4.0% - 4.5% ] 4.17% | 69,634 | 36.4% |
[ 4.0% - 4.5% ] 4.27% | 76,357 | 42.0% |
[ 4.0% - 4.5% ] 4.46% | 28,427 | 35.9% |
[ 4.5% - 5.0% ] 4.71% | 17,634 | 38.1% |
[ 4.5% - 5.0% ] 4.75% | 27,909 | 35.6% |
[ 4.5% - 5.0% ] 4.89% | 26,684 | 45.6% |
[ 5.5% - 6.0% ] 5.66% | 21,985 | 35.9% |
[ 6.5% - 7.0% ] 6.67% | 2,699 | 62.9% |
[ 7.5% - 8.0% ] 7.84% | 14,443 | 37.7% |
[ 8.5% - 9.0% ] 8.92% | 3,104 | 52.0% |
[ 8.5% - 9.0% ] 8.99% | 15,489 | 39.6% |
[ 10.5% - 11.0% ] 10.96% | 4,809 | 47.1% |
[ 11.0% - 11.5% ] 11.47% | 1,997 | 48.3% |
[ 11.5% - 12.0% ] 11.61% | 422 | 57.7% |
[ 14.5% - 15.0% ] 14.52% | 1,240 | 58.9% |
[ 25.5% - 26.0% ] 25.64% | 78 | 38.1% |