Immigrants from Middle Africa 3 or more Vehicles in Household

COMPARE

Immigrants from Middle Africa
Race
Ancestry
AfghanAfricanAlaska NativeAlaskan AthabascanAlbanianAleutAlsatianAmericanApacheArabArapahoArgentineanArmenianAssyrian/Chaldean/SyriacAustralianAustrianBahamianBangladeshiBarbadianBasqueBelgianBelizeanBermudanBhutaneseBlackfeetBolivianBrazilianBritishBritish West IndianBulgarianBurmeseCajunCambodianCanadianCape VerdeanCarpatho RusynCelticCentral AmericanCentral American IndianCherokeeCheyenneChickasawChileanChineseChippewaChoctawColombianColvilleComancheCosta RicanCreeCreekCroatianCrowCubanCypriotCzechCzechoslovakianDanishDelawareDominicanDutchDutch West IndianEastern EuropeanEcuadorianEgyptianEnglishEstonianEthiopianEuropeanFijianFilipinoFinnishFrenchFrench American IndianFrench CanadianGermanGerman RussianGhanaianGreekGuamanian/ChamorroGuatemalanGuyaneseHaitianHmongHonduranHopiHoumaHungarianIcelanderIndian (Asian)IndonesianInupiatIranianIraqiIrishIroquoisIsraeliItalianJamaicanJapaneseJordanianKenyanKiowaKoreanLaotianLatvianLebaneseLiberianLithuanianLumbeeLuxembourgerMacedonianMalaysianMalteseMarshalleseMenomineeMexicanMexican American IndianMongolianMoroccanNative HawaiianNavajoNepaleseNew ZealanderNicaraguanNigerianNorthern EuropeanNorwegianOkinawanOsageOttawaPaiutePakistaniPalestinianPanamanianParaguayanPennsylvania GermanPeruvianPimaPolishPortuguesePotawatomiPuebloPuerto RicanPuget Sound SalishRomanianRussianSalvadoranSamoanScandinavianScotch-IrishScottishSeminoleSenegaleseSerbianShoshoneSierra LeoneanSiouxSlavicSlovakSloveneSomaliSouth AfricanSouth AmericanSouth American IndianSoviet UnionSpaniardSpanishSpanish AmericanSpanish American IndianSri LankanSubsaharan AfricanSudaneseSwedishSwissSyrianTaiwaneseThaiTlingit-HaidaTohono O'OdhamTonganTrinidadian and TobagonianTsimshianTurkishU.S. Virgin IslanderUgandanUkrainianUruguayanUteVenezuelanVietnameseWelshWest IndianYakamaYaquiYugoslavianYumanYup'ikZimbabwean
Immigration
NonimmigrantsImmigrantsAfghanistanAfricaAlbaniaArgentinaArmeniaAsiaAustraliaAustriaBahamasBangladeshBarbadosBelarusBelgiumBelizeBoliviaBosnia and HerzegovinaBrazilBulgariaBurma/MyanmarCabo VerdeCambodiaCameroonCanadaCaribbeanCentral AmericaChileChinaColombiaCongoCosta RicaCroatiaCubaCzechoslovakiaDenmarkDominicaDominican RepublicEastern AfricaEastern AsiaEastern EuropeEcuadorEgyptEl SalvadorEnglandEritreaEthiopiaEuropeFijiFranceGermanyGhanaGreeceGrenadaGuatemalaGuyanaHaitiHondurasHong KongHungaryIndiaIndonesiaIranIraqIrelandIsraelItalyJamaicaJapanJordanKazakhstanKenyaKoreaKuwaitLaosLatin AmericaLatviaLebanonLiberiaLithuaniaMalaysiaMexicoMicronesiaMiddle AfricaMoldovaMoroccoNepalNetherlandsNicaraguaNigeriaNorth AmericaNorth MacedoniaNorthern AfricaNorthern EuropeNorwayOceaniaPakistanPanamaPeruPhilippinesPolandPortugalRomaniaRussiaSaudi ArabiaScotlandSenegalSerbiaSierra LeoneSingaporeSomaliaSouth AfricaSouth AmericaSouth Central AsiaSouth Eastern AsiaSouthern EuropeSpainSri LankaSt. Vincent and the GrenadinesSudanSwedenSwitzerlandSyriaTaiwanThailandTrinidad and TobagoTurkeyUgandaUkraineUruguayUzbekistanVenezuelaVietnamWest IndiesWestern AfricaWestern AsiaWestern EuropeYemenZaireZimbabweAzores
Select to Compare
Race
Ancestry
AfghanAfricanAlaska NativeAlaskan AthabascanAlbanianAleutAlsatianAmericanApacheArabArapahoArgentineanArmenianAssyrian/Chaldean/SyriacAustralianAustrianBahamianBangladeshiBarbadianBasqueBelgianBelizeanBermudanBhutaneseBlackfeetBolivianBrazilianBritishBritish West IndianBulgarianBurmeseCajunCambodianCanadianCape VerdeanCarpatho RusynCelticCentral AmericanCentral American IndianCherokeeCheyenneChickasawChileanChineseChippewaChoctawColombianColvilleComancheCosta RicanCreeCreekCroatianCrowCubanCypriotCzechCzechoslovakianDanishDelawareDominicanDutchDutch West IndianEastern EuropeanEcuadorianEgyptianEnglishEstonianEthiopianEuropeanFijianFilipinoFinnishFrenchFrench American IndianFrench CanadianGermanGerman RussianGhanaianGreekGuamanian/ChamorroGuatemalanGuyaneseHaitianHmongHonduranHopiHoumaHungarianIcelanderIndian (Asian)IndonesianInupiatIranianIraqiIrishIroquoisIsraeliItalianJamaicanJapaneseJordanianKenyanKiowaKoreanLaotianLatvianLebaneseLiberianLithuanianLumbeeLuxembourgerMacedonianMalaysianMalteseMarshalleseMenomineeMexicanMexican American IndianMongolianMoroccanNative HawaiianNavajoNepaleseNew ZealanderNicaraguanNigerianNorthern EuropeanNorwegianOkinawanOsageOttawaPaiutePakistaniPalestinianPanamanianParaguayanPennsylvania GermanPeruvianPimaPolishPortuguesePotawatomiPuebloPuerto RicanPuget Sound SalishRomanianRussianSalvadoranSamoanScandinavianScotch-IrishScottishSeminoleSenegaleseSerbianShoshoneSierra LeoneanSiouxSlavicSlovakSloveneSomaliSouth AfricanSouth AmericanSouth American IndianSoviet UnionSpaniardSpanishSpanish AmericanSpanish American IndianSri LankanSubsaharan AfricanSudaneseSwedishSwissSyrianTaiwaneseThaiTlingit-HaidaTohono O'OdhamTonganTrinidadian and TobagonianTsimshianTurkishU.S. Virgin IslanderUgandanUkrainianUruguayanUteVenezuelanVietnameseWelshWest IndianYakamaYaquiYugoslavianYumanYup'ikZimbabwean
Immigration
NonimmigrantsImmigrantsAfghanistanAfricaAlbaniaArgentinaArmeniaAsiaAustraliaAustriaBahamasBangladeshBarbadosBelarusBelgiumBelizeBoliviaBosnia and HerzegovinaBrazilBulgariaBurma/MyanmarCabo VerdeCambodiaCameroonCanadaCaribbeanCentral AmericaChileChinaColombiaCongoCosta RicaCroatiaCubaCzechoslovakiaDenmarkDominicaDominican RepublicEastern AfricaEastern AsiaEastern EuropeEcuadorEgyptEl SalvadorEnglandEritreaEthiopiaEuropeFijiFranceGermanyGhanaGreeceGrenadaGuatemalaGuyanaHaitiHondurasHong KongHungaryIndiaIndonesiaIranIraqIrelandIsraelItalyJamaicaJapanJordanKazakhstanKenyaKoreaKuwaitLaosLatin AmericaLatviaLebanonLiberiaLithuaniaMalaysiaMexicoMicronesiaMoldovaMoroccoNepalNetherlandsNicaraguaNigeriaNorth AmericaNorth MacedoniaNorthern AfricaNorthern EuropeNorwayOceaniaPakistanPanamaPeruPhilippinesPolandPortugalRomaniaRussiaSaudi ArabiaScotlandSenegalSerbiaSierra LeoneSingaporeSomaliaSouth AfricaSouth AmericaSouth Central AsiaSouth Eastern AsiaSouthern EuropeSpainSri LankaSt. Vincent and the GrenadinesSudanSwedenSwitzerlandSyriaTaiwanThailandTrinidad and TobagoTurkeyUgandaUkraineUruguayUzbekistanVenezuelaVietnamWest IndiesWestern AfricaWestern AsiaWestern EuropeYemenZaireZimbabweAzores
3 or more Vehicles in Household
Income
Poverty
Unemployment
Labor Participation
Family Structure
Vehicle Availability
Education Level
Disability

Immigrants from Middle Africa 3 or more Vehicles in Household
Tragic

18.2%
3+ VEHICLES AVAILABLE
3.1/ 100
METRIC RATING
239th/ 347
METRIC RANK

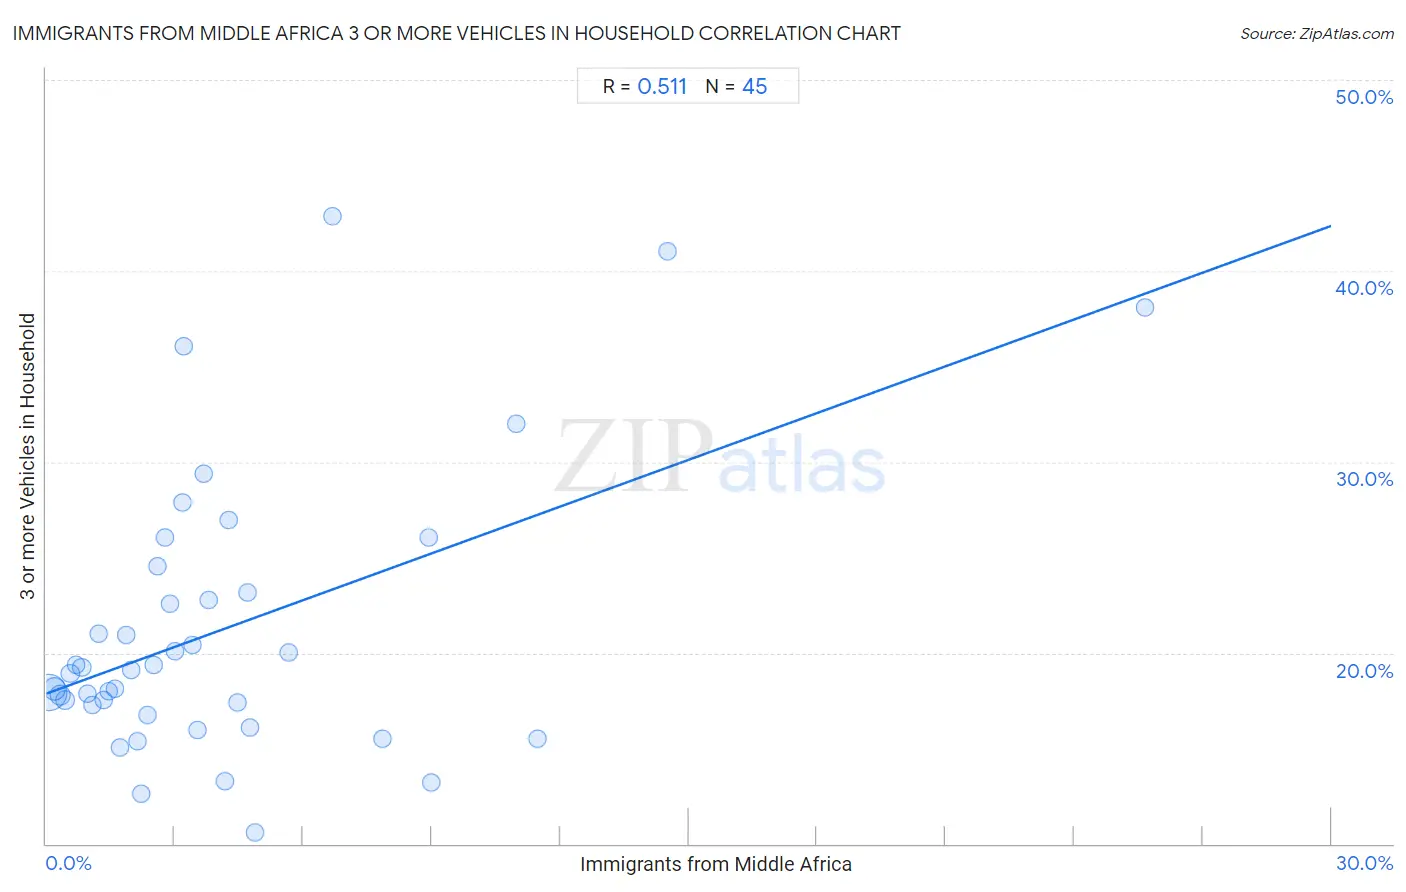
Immigrants from Middle Africa 3 or more Vehicles in Household Correlation Chart

The statistical analysis conducted on geographies consisting of 202,639,411 people shows a substantial positive correlation between the proportion of Immigrants from Middle Africa and percentage of households with 3 or more vehicles available in the United States with a correlation coefficient (R) of 0.511 and weighted average of 18.2%. On average, for every 1% (one percent) increase in Immigrants from Middle Africa within a typical geography, there is an increase of 0.82% in percentage of households with 3 or more vehicles available.
Immigrants from Middle Africa 3 or more Vehicles in Household
It is essential to understand that the correlation between the percentage of Immigrants from Middle Africa and percentage of households with 3 or more vehicles available does not imply a direct cause-and-effect relationship. It remains uncertain whether the presence of Immigrants from Middle Africa influences an upward or downward trend in the level of percentage of households with 3 or more vehicles available within an area, or if Immigrants from Middle Africa simply ended up residing in those areas with higher or lower levels of percentage of households with 3 or more vehicles available due to other factors.

Demographics Similar to Immigrants from Middle Africa by 3 or more Vehicles in Household

In terms of 3 or more vehicles in household, the demographic groups most similar to Immigrants from Middle Africa are Immigrants from Honduras (18.2%, a difference of 0.010%), Immigrants from China (18.2%, a difference of 0.13%), Indonesian (18.3%, a difference of 0.24%), Immigrants from Malaysia (18.3%, a difference of 0.28%), and African (18.2%, a difference of 0.32%).
DemographicsRating | Rank3 or more Vehicles in Household
Immigrants from Uganda
4.6
/100
|
#232
Tragic
18.4%
Hondurans
4.6
/100
|
#233
Tragic
18.4%
Immigrants from North Macedonia
4.4
/100
|
#234
Tragic
18.4%
Sierra Leoneans
3.9
/100
|
#235
Tragic
18.3%
Immigrants from Malaysia
3.6
/100
|
#236
Tragic
18.3%
Indonesians
3.5
/100
|
#237
Tragic
18.3%
Immigrants from Honduras
3.1
/100
|
#238
Tragic
18.2%
Immigrants from Middle Africa
3.1
/100
|
#239
Tragic
18.2%
Immigrants from China
2.9
/100
|
#240
Tragic
18.2%
Africans
2.7
/100
|
#241
Tragic
18.2%
Hopi
2.5
/100
|
#242
Tragic
18.2%
Immigrants from Europe
2.4
/100
|
#243
Tragic
18.1%
Mongolians
2.3
/100
|
#244
Tragic
18.1%
Immigrants from Belize
2.1
/100
|
#245
Tragic
18.1%
Immigrants from Australia
2.0
/100
|
#246
Tragic
18.1%

Immigrants from Middle Africa 3 or more Vehicles in Household Correlation Summary

MeasurementImmigrants from Middle Africa Data3 or more Vehicles in Household Data
Minimum0.047%10.6%
Maximum25.6%42.9%
Range25.6%32.3%
Mean4.1%21.2%
Median2.9%19.1%
Interquartile 25% (IQ1)1.4%17.0%
Interquartile 75% (IQ3)4.7%23.8%
Interquartile Range (IQR)3.3%6.8%
Standard Deviation (Sample)4.6%7.3%
Standard Deviation (Population)4.5%7.2%

Correlation Details

Immigrants from Middle Africa PercentileSample Size3 or more Vehicles in Household
[
0.0%
-
0.5%
]
0.047%
132,018,98117.9%
[
0.0%
-
0.5%
]
0.19%
33,285,03218.1%
[
0.0%
-
0.5%
]
0.32%
15,087,82617.8%
[
0.0%
-
0.5%
]
0.43%
7,454,84017.5%
[
0.5%
-
1.0%
]
0.57%
4,565,02918.9%
[
0.5%
-
1.0%
]
0.70%
2,671,28519.4%
[
0.5%
-
1.0%
]
0.83%
1,571,31619.2%
[
0.5%
-
1.0%
]
0.96%
958,26417.9%
[
1.0%
-
1.5%
]
1.08%
945,22917.3%
[
1.0%
-
1.5%
]
1.21%
887,36121.0%
[
1.0%
-
1.5%
]
1.34%
620,69517.5%
[
1.0%
-
1.5%
]
1.45%
277,79518.0%
[
1.5%
-
2.0%
]
1.62%
227,60518.1%
[
1.5%
-
2.0%
]
1.73%
294,66615.0%
[
1.5%
-
2.0%
]
1.86%
294,75321.0%
[
1.5%
-
2.0%
]
1.98%
178,80319.1%
[
2.0%
-
2.5%
]
2.14%
122,31115.3%
[
2.0%
-
2.5%
]
2.23%
153,28712.6%
[
2.0%
-
2.5%
]
2.37%
199,55316.7%
[
2.0%
-
2.5%
]
2.50%
127,03319.4%
[
2.5%
-
3.0%
]
2.60%
12,36524.6%
[
2.5%
-
3.0%
]
2.77%
10,21026.0%
[
2.5%
-
3.0%
]
2.90%
105,60722.6%
[
3.0%
-
3.5%
]
3.02%
49,85620.1%
[
3.0%
-
3.5%
]
3.17%
19,65527.8%
[
3.0%
-
3.5%
]
3.21%
3,64836.1%
[
3.0%
-
3.5%
]
3.40%
43,55420.4%
[
3.5%
-
4.0%
]
3.54%
125,90515.9%
[
3.5%
-
4.0%
]
3.69%
2,33029.4%
[
3.5%
-
4.0%
]
3.79%
12,12822.8%
[
4.0%
-
4.5%
]
4.17%
69,63413.3%
[
4.0%
-
4.5%
]
4.27%
76,35726.9%
[
4.0%
-
4.5%
]
4.46%
28,42717.4%
[
4.5%
-
5.0%
]
4.71%
17,63423.1%
[
4.5%
-
5.0%
]
4.75%
27,90916.1%
[
4.5%
-
5.0%
]
4.89%
26,68410.6%
[
5.5%
-
6.0%
]
5.66%
21,98520.0%
[
6.5%
-
7.0%
]
6.67%
2,69942.9%
[
7.5%
-
8.0%
]
7.84%
14,44315.5%
[
8.5%
-
9.0%
]
8.92%
3,10426.0%
[
8.5%
-
9.0%
]
8.99%
15,48913.2%
[
10.5%
-
11.0%
]
10.96%
4,80932.0%
[
11.0%
-
11.5%
]
11.47%
1,99715.5%
[
14.5%
-
15.0%
]
14.52%
1,24041.1%
[
25.5%
-
26.0%
]
25.64%
7838.1%