Immigrants from Middle Africa 1 or more Vehicles in Household

COMPARE

Immigrants from Middle Africa
Race
Ancestry
AfghanAfricanAlaska NativeAlaskan AthabascanAlbanianAleutAlsatianAmericanApacheArabArapahoArgentineanArmenianAssyrian/Chaldean/SyriacAustralianAustrianBahamianBangladeshiBarbadianBasqueBelgianBelizeanBermudanBhutaneseBlackfeetBolivianBrazilianBritishBritish West IndianBulgarianBurmeseCajunCambodianCanadianCape VerdeanCarpatho RusynCelticCentral AmericanCentral American IndianCherokeeCheyenneChickasawChileanChineseChippewaChoctawColombianColvilleComancheCosta RicanCreeCreekCroatianCrowCubanCypriotCzechCzechoslovakianDanishDelawareDominicanDutchDutch West IndianEastern EuropeanEcuadorianEgyptianEnglishEstonianEthiopianEuropeanFijianFilipinoFinnishFrenchFrench American IndianFrench CanadianGermanGerman RussianGhanaianGreekGuamanian/ChamorroGuatemalanGuyaneseHaitianHmongHonduranHopiHoumaHungarianIcelanderIndian (Asian)IndonesianInupiatIranianIraqiIrishIroquoisIsraeliItalianJamaicanJapaneseJordanianKenyanKiowaKoreanLaotianLatvianLebaneseLiberianLithuanianLumbeeLuxembourgerMacedonianMalaysianMalteseMarshalleseMenomineeMexicanMexican American IndianMongolianMoroccanNative HawaiianNavajoNepaleseNew ZealanderNicaraguanNigerianNorthern EuropeanNorwegianOkinawanOsageOttawaPaiutePakistaniPalestinianPanamanianParaguayanPennsylvania GermanPeruvianPimaPolishPortuguesePotawatomiPuebloPuerto RicanPuget Sound SalishRomanianRussianSalvadoranSamoanScandinavianScotch-IrishScottishSeminoleSenegaleseSerbianShoshoneSierra LeoneanSiouxSlavicSlovakSloveneSomaliSouth AfricanSouth AmericanSouth American IndianSoviet UnionSpaniardSpanishSpanish AmericanSpanish American IndianSri LankanSubsaharan AfricanSudaneseSwedishSwissSyrianTaiwaneseThaiTlingit-HaidaTohono O'OdhamTonganTrinidadian and TobagonianTsimshianTurkishU.S. Virgin IslanderUgandanUkrainianUruguayanUteVenezuelanVietnameseWelshWest IndianYakamaYaquiYugoslavianYumanYup'ikZimbabwean
Immigration
NonimmigrantsImmigrantsAfghanistanAfricaAlbaniaArgentinaArmeniaAsiaAustraliaAustriaBahamasBangladeshBarbadosBelarusBelgiumBelizeBoliviaBosnia and HerzegovinaBrazilBulgariaBurma/MyanmarCabo VerdeCambodiaCameroonCanadaCaribbeanCentral AmericaChileChinaColombiaCongoCosta RicaCroatiaCubaCzechoslovakiaDenmarkDominicaDominican RepublicEastern AfricaEastern AsiaEastern EuropeEcuadorEgyptEl SalvadorEnglandEritreaEthiopiaEuropeFijiFranceGermanyGhanaGreeceGrenadaGuatemalaGuyanaHaitiHondurasHong KongHungaryIndiaIndonesiaIranIraqIrelandIsraelItalyJamaicaJapanJordanKazakhstanKenyaKoreaKuwaitLaosLatin AmericaLatviaLebanonLiberiaLithuaniaMalaysiaMexicoMicronesiaMiddle AfricaMoldovaMoroccoNepalNetherlandsNicaraguaNigeriaNorth AmericaNorth MacedoniaNorthern AfricaNorthern EuropeNorwayOceaniaPakistanPanamaPeruPhilippinesPolandPortugalRomaniaRussiaSaudi ArabiaScotlandSenegalSerbiaSierra LeoneSingaporeSomaliaSouth AfricaSouth AmericaSouth Central AsiaSouth Eastern AsiaSouthern EuropeSpainSri LankaSt. Vincent and the GrenadinesSudanSwedenSwitzerlandSyriaTaiwanThailandTrinidad and TobagoTurkeyUgandaUkraineUruguayUzbekistanVenezuelaVietnamWest IndiesWestern AfricaWestern AsiaWestern EuropeYemenZaireZimbabweAzores
Select to Compare
Race
Ancestry
AfghanAfricanAlaska NativeAlaskan AthabascanAlbanianAleutAlsatianAmericanApacheArabArapahoArgentineanArmenianAssyrian/Chaldean/SyriacAustralianAustrianBahamianBangladeshiBarbadianBasqueBelgianBelizeanBermudanBhutaneseBlackfeetBolivianBrazilianBritishBritish West IndianBulgarianBurmeseCajunCambodianCanadianCape VerdeanCarpatho RusynCelticCentral AmericanCentral American IndianCherokeeCheyenneChickasawChileanChineseChippewaChoctawColombianColvilleComancheCosta RicanCreeCreekCroatianCrowCubanCypriotCzechCzechoslovakianDanishDelawareDominicanDutchDutch West IndianEastern EuropeanEcuadorianEgyptianEnglishEstonianEthiopianEuropeanFijianFilipinoFinnishFrenchFrench American IndianFrench CanadianGermanGerman RussianGhanaianGreekGuamanian/ChamorroGuatemalanGuyaneseHaitianHmongHonduranHopiHoumaHungarianIcelanderIndian (Asian)IndonesianInupiatIranianIraqiIrishIroquoisIsraeliItalianJamaicanJapaneseJordanianKenyanKiowaKoreanLaotianLatvianLebaneseLiberianLithuanianLumbeeLuxembourgerMacedonianMalaysianMalteseMarshalleseMenomineeMexicanMexican American IndianMongolianMoroccanNative HawaiianNavajoNepaleseNew ZealanderNicaraguanNigerianNorthern EuropeanNorwegianOkinawanOsageOttawaPaiutePakistaniPalestinianPanamanianParaguayanPennsylvania GermanPeruvianPimaPolishPortuguesePotawatomiPuebloPuerto RicanPuget Sound SalishRomanianRussianSalvadoranSamoanScandinavianScotch-IrishScottishSeminoleSenegaleseSerbianShoshoneSierra LeoneanSiouxSlavicSlovakSloveneSomaliSouth AfricanSouth AmericanSouth American IndianSoviet UnionSpaniardSpanishSpanish AmericanSpanish American IndianSri LankanSubsaharan AfricanSudaneseSwedishSwissSyrianTaiwaneseThaiTlingit-HaidaTohono O'OdhamTonganTrinidadian and TobagonianTsimshianTurkishU.S. Virgin IslanderUgandanUkrainianUruguayanUteVenezuelanVietnameseWelshWest IndianYakamaYaquiYugoslavianYumanYup'ikZimbabwean
Immigration
NonimmigrantsImmigrantsAfghanistanAfricaAlbaniaArgentinaArmeniaAsiaAustraliaAustriaBahamasBangladeshBarbadosBelarusBelgiumBelizeBoliviaBosnia and HerzegovinaBrazilBulgariaBurma/MyanmarCabo VerdeCambodiaCameroonCanadaCaribbeanCentral AmericaChileChinaColombiaCongoCosta RicaCroatiaCubaCzechoslovakiaDenmarkDominicaDominican RepublicEastern AfricaEastern AsiaEastern EuropeEcuadorEgyptEl SalvadorEnglandEritreaEthiopiaEuropeFijiFranceGermanyGhanaGreeceGrenadaGuatemalaGuyanaHaitiHondurasHong KongHungaryIndiaIndonesiaIranIraqIrelandIsraelItalyJamaicaJapanJordanKazakhstanKenyaKoreaKuwaitLaosLatin AmericaLatviaLebanonLiberiaLithuaniaMalaysiaMexicoMicronesiaMoldovaMoroccoNepalNetherlandsNicaraguaNigeriaNorth AmericaNorth MacedoniaNorthern AfricaNorthern EuropeNorwayOceaniaPakistanPanamaPeruPhilippinesPolandPortugalRomaniaRussiaSaudi ArabiaScotlandSenegalSerbiaSierra LeoneSingaporeSomaliaSouth AfricaSouth AmericaSouth Central AsiaSouth Eastern AsiaSouthern EuropeSpainSri LankaSt. Vincent and the GrenadinesSudanSwedenSwitzerlandSyriaTaiwanThailandTrinidad and TobagoTurkeyUgandaUkraineUruguayUzbekistanVenezuelaVietnamWest IndiesWestern AfricaWestern AsiaWestern EuropeYemenZaireZimbabweAzores
1 or more Vehicles in Household
Income
Poverty
Unemployment
Labor Participation
Family Structure
Vehicle Availability
Education Level
Disability

Immigrants from Middle Africa 1 or more Vehicles in Household
Good

89.9%
1+ VEHICLES AVAILABLE
62.2/ 100
METRIC RATING
166th/ 347
METRIC RANK

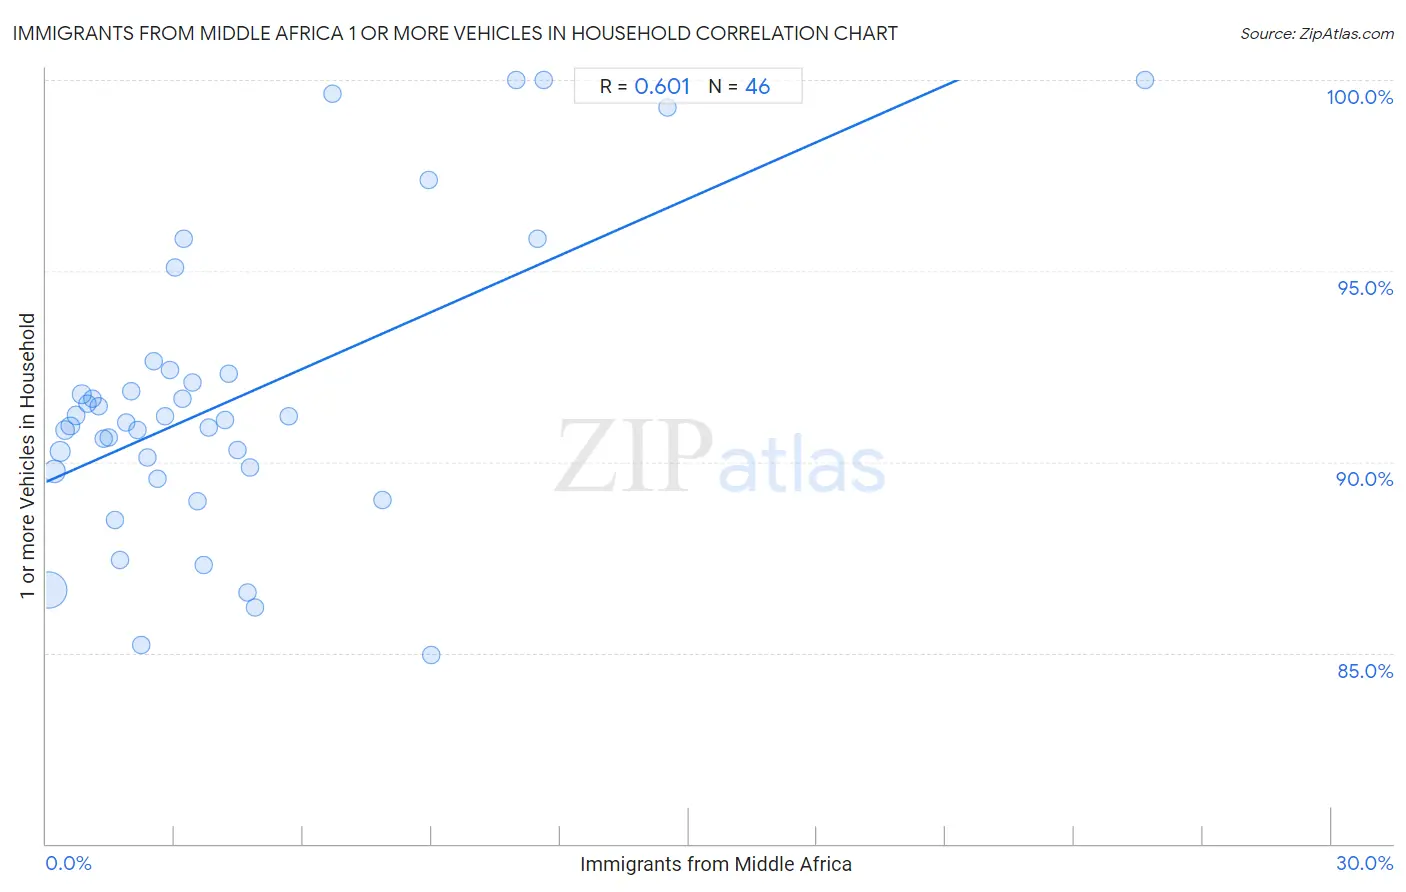
Immigrants from Middle Africa 1 or more Vehicles in Household Correlation Chart

The statistical analysis conducted on geographies consisting of 202,674,043 people shows a significant positive correlation between the proportion of Immigrants from Middle Africa and percentage of households with 1 or more vehicles available in the United States with a correlation coefficient (R) of 0.601 and weighted average of 89.9%. On average, for every 1% (one percent) increase in Immigrants from Middle Africa within a typical geography, there is an increase of 0.49% in percentage of households with 1 or more vehicles available.
Immigrants from Middle Africa 1 or more Vehicles in Household
It is essential to understand that the correlation between the percentage of Immigrants from Middle Africa and percentage of households with 1 or more vehicles available does not imply a direct cause-and-effect relationship. It remains uncertain whether the presence of Immigrants from Middle Africa influences an upward or downward trend in the level of percentage of households with 1 or more vehicles available within an area, or if Immigrants from Middle Africa simply ended up residing in those areas with higher or lower levels of percentage of households with 1 or more vehicles available due to other factors.

Demographics Similar to Immigrants from Middle Africa by 1 or more Vehicles in Household

In terms of 1 or more vehicles in household, the demographic groups most similar to Immigrants from Middle Africa are Immigrants from Saudi Arabia (89.9%, a difference of 0.010%), Comanche (89.9%, a difference of 0.020%), Immigrants from Latin America (89.8%, a difference of 0.030%), Immigrants from Cambodia (89.8%, a difference of 0.040%), and Native/Alaskan (89.8%, a difference of 0.040%).
DemographicsRating | Rank1 or more Vehicles in Household
South Africans
69.7
/100
|
#159
Good
90.0%
Immigrants from Indonesia
68.8
/100
|
#160
Good
90.0%
Salvadorans
68.7
/100
|
#161
Good
90.0%
Spanish American Indians
67.0
/100
|
#162
Good
89.9%
Immigrants from Austria
65.5
/100
|
#163
Good
89.9%
Comanche
63.4
/100
|
#164
Good
89.9%
Immigrants from Saudi Arabia
62.6
/100
|
#165
Good
89.9%
Immigrants from Middle Africa
62.2
/100
|
#166
Good
89.9%
Immigrants from Latin America
60.3
/100
|
#167
Good
89.8%
Immigrants from Cambodia
60.1
/100
|
#168
Good
89.8%
Natives/Alaskans
59.5
/100
|
#169
Average
89.8%
Immigrants from Costa Rica
57.6
/100
|
#170
Average
89.8%
French American Indians
54.4
/100
|
#171
Average
89.8%
Indonesians
53.0
/100
|
#172
Average
89.7%
Lumbee
52.8
/100
|
#173
Average
89.7%

Immigrants from Middle Africa 1 or more Vehicles in Household Correlation Summary

MeasurementImmigrants from Middle Africa Data1 or more Vehicles in Household Data
Minimum0.047%85.0%
Maximum25.6%100.0%
Range25.6%15.0%
Mean4.3%91.6%
Median3.0%91.1%
Interquartile 25% (IQ1)1.5%89.7%
Interquartile 75% (IQ3)4.8%92.3%
Interquartile Range (IQR)3.3%2.5%
Standard Deviation (Sample)4.7%3.8%
Standard Deviation (Population)4.6%3.8%

Correlation Details

Immigrants from Middle Africa PercentileSample Size1 or more Vehicles in Household
[
0.0%
-
0.5%
]
0.047%
132,030,23686.6%
[
0.0%
-
0.5%
]
0.19%
33,287,56589.7%
[
0.0%
-
0.5%
]
0.32%
15,092,19890.3%
[
0.0%
-
0.5%
]
0.43%
7,461,70990.8%
[
0.5%
-
1.0%
]
0.57%
4,568,99590.9%
[
0.5%
-
1.0%
]
0.70%
2,671,86791.2%
[
0.5%
-
1.0%
]
0.83%
1,571,31691.8%
[
0.5%
-
1.0%
]
0.96%
959,15791.5%
[
1.0%
-
1.5%
]
1.08%
946,04691.7%
[
1.0%
-
1.5%
]
1.21%
887,36191.5%
[
1.0%
-
1.5%
]
1.34%
620,69590.6%
[
1.0%
-
1.5%
]
1.45%
280,19990.6%
[
1.5%
-
2.0%
]
1.62%
227,60588.5%
[
1.5%
-
2.0%
]
1.73%
294,66687.4%
[
1.5%
-
2.0%
]
1.86%
294,75391.0%
[
1.5%
-
2.0%
]
1.98%
178,80391.8%
[
2.0%
-
2.5%
]
2.14%
122,31190.8%
[
2.0%
-
2.5%
]
2.23%
153,28785.2%
[
2.0%
-
2.5%
]
2.37%
199,55390.1%
[
2.0%
-
2.5%
]
2.50%
127,03392.6%
[
2.5%
-
3.0%
]
2.60%
12,36589.6%
[
2.5%
-
3.0%
]
2.77%
10,21091.2%
[
2.5%
-
3.0%
]
2.90%
105,60792.4%
[
3.0%
-
3.5%
]
3.02%
49,85695.1%
[
3.0%
-
3.5%
]
3.17%
20,17491.7%
[
3.0%
-
3.5%
]
3.21%
3,64895.8%
[
3.0%
-
3.5%
]
3.40%
43,55492.1%
[
3.5%
-
4.0%
]
3.54%
125,90589.0%
[
3.5%
-
4.0%
]
3.69%
2,33087.3%
[
3.5%
-
4.0%
]
3.79%
12,12890.9%
[
4.0%
-
4.5%
]
4.17%
69,63491.1%
[
4.0%
-
4.5%
]
4.27%
76,35792.3%
[
4.0%
-
4.5%
]
4.46%
28,42790.3%
[
4.5%
-
5.0%
]
4.71%
17,63486.6%
[
4.5%
-
5.0%
]
4.75%
27,90989.9%
[
4.5%
-
5.0%
]
4.89%
26,68486.2%
[
5.5%
-
6.0%
]
5.66%
21,98591.2%
[
6.5%
-
7.0%
]
6.67%
2,69999.6%
[
7.5%
-
8.0%
]
7.84%
14,44389.0%
[
8.5%
-
9.0%
]
8.92%
3,10497.4%
[
8.5%
-
9.0%
]
8.99%
15,48985.0%
[
10.5%
-
11.0%
]
10.96%
4,809100.0%
[
11.0%
-
11.5%
]
11.47%
1,99795.9%
[
11.5%
-
12.0%
]
11.61%
422100.0%
[
14.5%
-
15.0%
]
14.52%
1,24099.3%
[
25.5%
-
26.0%
]
25.64%
78100.0%