Immigrants from Middle Africa Self-Care Disability

COMPARE

Immigrants from Middle Africa
Race
Ancestry
AfghanAfricanAlaska NativeAlaskan AthabascanAlbanianAleutAlsatianAmericanApacheArabArapahoArgentineanArmenianAssyrian/Chaldean/SyriacAustralianAustrianBahamianBangladeshiBarbadianBasqueBelgianBelizeanBermudanBhutaneseBlackfeetBolivianBrazilianBritishBritish West IndianBulgarianBurmeseCajunCambodianCanadianCape VerdeanCarpatho RusynCelticCentral AmericanCentral American IndianCherokeeCheyenneChickasawChileanChineseChippewaChoctawColombianColvilleComancheCosta RicanCreeCreekCroatianCrowCubanCypriotCzechCzechoslovakianDanishDelawareDominicanDutchDutch West IndianEastern EuropeanEcuadorianEgyptianEnglishEstonianEthiopianEuropeanFijianFilipinoFinnishFrenchFrench American IndianFrench CanadianGermanGerman RussianGhanaianGreekGuamanian/ChamorroGuatemalanGuyaneseHaitianHmongHonduranHopiHoumaHungarianIcelanderIndian (Asian)IndonesianInupiatIranianIraqiIrishIroquoisIsraeliItalianJamaicanJapaneseJordanianKenyanKiowaKoreanLaotianLatvianLebaneseLiberianLithuanianLumbeeLuxembourgerMacedonianMalaysianMalteseMarshalleseMenomineeMexicanMexican American IndianMongolianMoroccanNative HawaiianNavajoNepaleseNew ZealanderNicaraguanNigerianNorthern EuropeanNorwegianOkinawanOsageOttawaPaiutePakistaniPalestinianPanamanianParaguayanPennsylvania GermanPeruvianPimaPolishPortuguesePotawatomiPuebloPuerto RicanPuget Sound SalishRomanianRussianSalvadoranSamoanScandinavianScotch-IrishScottishSeminoleSenegaleseSerbianShoshoneSierra LeoneanSiouxSlavicSlovakSloveneSomaliSouth AfricanSouth AmericanSouth American IndianSoviet UnionSpaniardSpanishSpanish AmericanSpanish American IndianSri LankanSubsaharan AfricanSudaneseSwedishSwissSyrianTaiwaneseThaiTlingit-HaidaTohono O'OdhamTonganTrinidadian and TobagonianTsimshianTurkishU.S. Virgin IslanderUgandanUkrainianUruguayanUteVenezuelanVietnameseWelshWest IndianYakamaYaquiYugoslavianYumanYup'ikZimbabwean
Immigration
NonimmigrantsImmigrantsAfghanistanAfricaAlbaniaArgentinaArmeniaAsiaAustraliaAustriaBahamasBangladeshBarbadosBelarusBelgiumBelizeBoliviaBosnia and HerzegovinaBrazilBulgariaBurma/MyanmarCabo VerdeCambodiaCameroonCanadaCaribbeanCentral AmericaChileChinaColombiaCongoCosta RicaCroatiaCubaCzechoslovakiaDenmarkDominicaDominican RepublicEastern AfricaEastern AsiaEastern EuropeEcuadorEgyptEl SalvadorEnglandEritreaEthiopiaEuropeFijiFranceGermanyGhanaGreeceGrenadaGuatemalaGuyanaHaitiHondurasHong KongHungaryIndiaIndonesiaIranIraqIrelandIsraelItalyJamaicaJapanJordanKazakhstanKenyaKoreaKuwaitLaosLatin AmericaLatviaLebanonLiberiaLithuaniaMalaysiaMexicoMicronesiaMiddle AfricaMoldovaMoroccoNepalNetherlandsNicaraguaNigeriaNorth AmericaNorth MacedoniaNorthern AfricaNorthern EuropeNorwayOceaniaPakistanPanamaPeruPhilippinesPolandPortugalRomaniaRussiaSaudi ArabiaScotlandSenegalSerbiaSierra LeoneSingaporeSomaliaSouth AfricaSouth AmericaSouth Central AsiaSouth Eastern AsiaSouthern EuropeSpainSri LankaSt. Vincent and the GrenadinesSudanSwedenSwitzerlandSyriaTaiwanThailandTrinidad and TobagoTurkeyUgandaUkraineUruguayUzbekistanVenezuelaVietnamWest IndiesWestern AfricaWestern AsiaWestern EuropeYemenZaireZimbabweAzores
Select to Compare
Race
Ancestry
AfghanAfricanAlaska NativeAlaskan AthabascanAlbanianAleutAlsatianAmericanApacheArabArapahoArgentineanArmenianAssyrian/Chaldean/SyriacAustralianAustrianBahamianBangladeshiBarbadianBasqueBelgianBelizeanBermudanBhutaneseBlackfeetBolivianBrazilianBritishBritish West IndianBulgarianBurmeseCajunCambodianCanadianCape VerdeanCarpatho RusynCelticCentral AmericanCentral American IndianCherokeeCheyenneChickasawChileanChineseChippewaChoctawColombianColvilleComancheCosta RicanCreeCreekCroatianCrowCubanCypriotCzechCzechoslovakianDanishDelawareDominicanDutchDutch West IndianEastern EuropeanEcuadorianEgyptianEnglishEstonianEthiopianEuropeanFijianFilipinoFinnishFrenchFrench American IndianFrench CanadianGermanGerman RussianGhanaianGreekGuamanian/ChamorroGuatemalanGuyaneseHaitianHmongHonduranHopiHoumaHungarianIcelanderIndian (Asian)IndonesianInupiatIranianIraqiIrishIroquoisIsraeliItalianJamaicanJapaneseJordanianKenyanKiowaKoreanLaotianLatvianLebaneseLiberianLithuanianLumbeeLuxembourgerMacedonianMalaysianMalteseMarshalleseMenomineeMexicanMexican American IndianMongolianMoroccanNative HawaiianNavajoNepaleseNew ZealanderNicaraguanNigerianNorthern EuropeanNorwegianOkinawanOsageOttawaPaiutePakistaniPalestinianPanamanianParaguayanPennsylvania GermanPeruvianPimaPolishPortuguesePotawatomiPuebloPuerto RicanPuget Sound SalishRomanianRussianSalvadoranSamoanScandinavianScotch-IrishScottishSeminoleSenegaleseSerbianShoshoneSierra LeoneanSiouxSlavicSlovakSloveneSomaliSouth AfricanSouth AmericanSouth American IndianSoviet UnionSpaniardSpanishSpanish AmericanSpanish American IndianSri LankanSubsaharan AfricanSudaneseSwedishSwissSyrianTaiwaneseThaiTlingit-HaidaTohono O'OdhamTonganTrinidadian and TobagonianTsimshianTurkishU.S. Virgin IslanderUgandanUkrainianUruguayanUteVenezuelanVietnameseWelshWest IndianYakamaYaquiYugoslavianYumanYup'ikZimbabwean
Immigration
NonimmigrantsImmigrantsAfghanistanAfricaAlbaniaArgentinaArmeniaAsiaAustraliaAustriaBahamasBangladeshBarbadosBelarusBelgiumBelizeBoliviaBosnia and HerzegovinaBrazilBulgariaBurma/MyanmarCabo VerdeCambodiaCameroonCanadaCaribbeanCentral AmericaChileChinaColombiaCongoCosta RicaCroatiaCubaCzechoslovakiaDenmarkDominicaDominican RepublicEastern AfricaEastern AsiaEastern EuropeEcuadorEgyptEl SalvadorEnglandEritreaEthiopiaEuropeFijiFranceGermanyGhanaGreeceGrenadaGuatemalaGuyanaHaitiHondurasHong KongHungaryIndiaIndonesiaIranIraqIrelandIsraelItalyJamaicaJapanJordanKazakhstanKenyaKoreaKuwaitLaosLatin AmericaLatviaLebanonLiberiaLithuaniaMalaysiaMexicoMicronesiaMoldovaMoroccoNepalNetherlandsNicaraguaNigeriaNorth AmericaNorth MacedoniaNorthern AfricaNorthern EuropeNorwayOceaniaPakistanPanamaPeruPhilippinesPolandPortugalRomaniaRussiaSaudi ArabiaScotlandSenegalSerbiaSierra LeoneSingaporeSomaliaSouth AfricaSouth AmericaSouth Central AsiaSouth Eastern AsiaSouthern EuropeSpainSri LankaSt. Vincent and the GrenadinesSudanSwedenSwitzerlandSyriaTaiwanThailandTrinidad and TobagoTurkeyUgandaUkraineUruguayUzbekistanVenezuelaVietnamWest IndiesWestern AfricaWestern AsiaWestern EuropeYemenZaireZimbabweAzores
Self-Care Disability
Income
Poverty
Unemployment
Labor Participation
Family Structure
Vehicle Availability
Education Level
Disability

Immigrants from Middle Africa Self-Care Disability
Exceptional

2.3%
SELF-CARE DISABILITY
99.0/ 100
METRIC RATING
77th/ 347
METRIC RANK

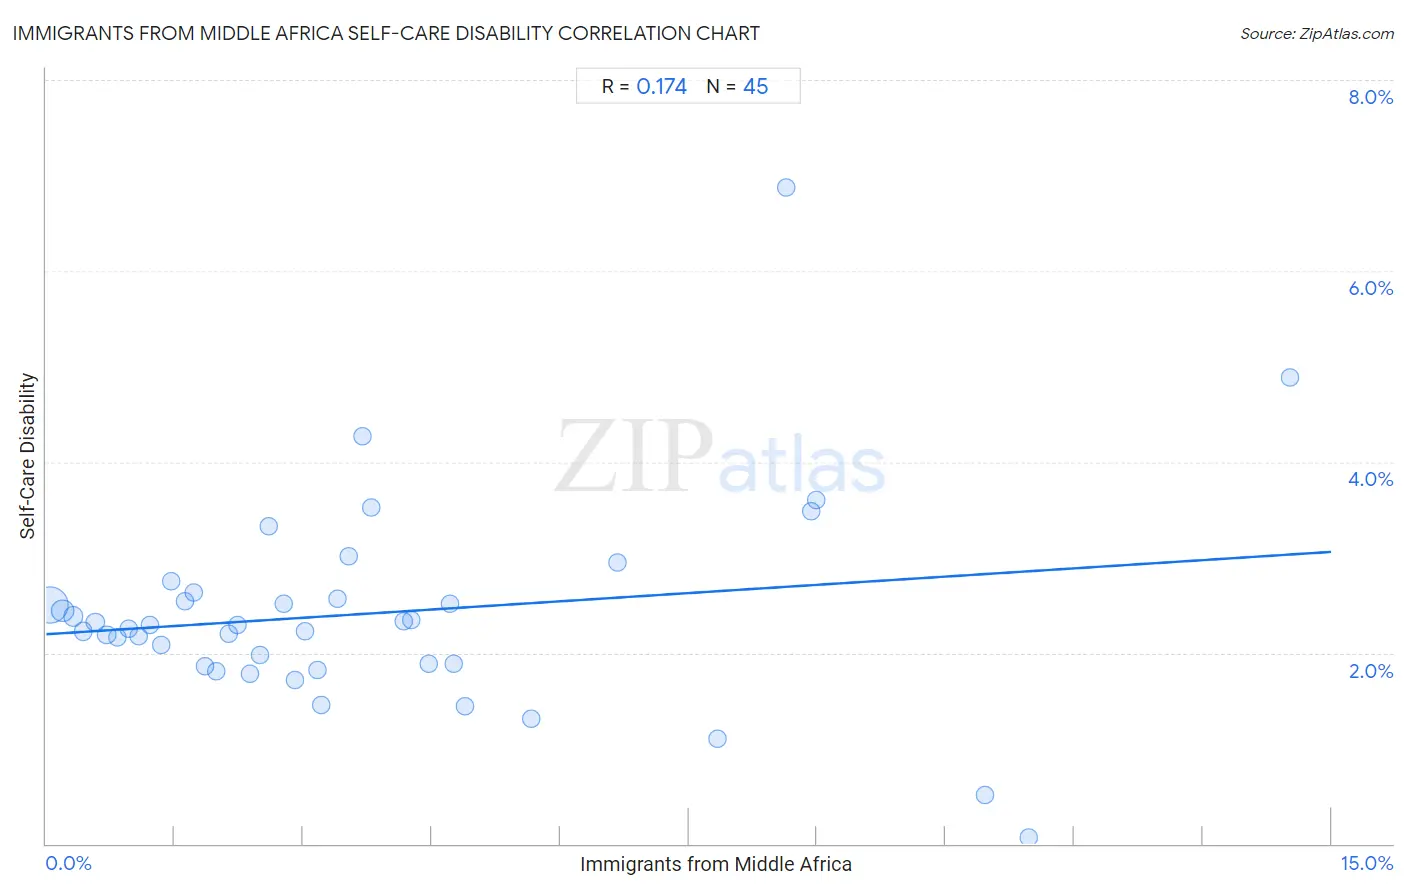
Immigrants from Middle Africa Self-Care Disability Correlation Chart

The statistical analysis conducted on geographies consisting of 202,614,589 people shows a poor positive correlation between the proportion of Immigrants from Middle Africa and percentage of population with self-care disability in the United States with a correlation coefficient (R) of 0.174 and weighted average of 2.3%. On average, for every 1% (one percent) increase in Immigrants from Middle Africa within a typical geography, there is an increase of 0.057% in percentage of population with self-care disability.
Immigrants from Middle Africa Self-Care Disability
It is essential to understand that the correlation between the percentage of Immigrants from Middle Africa and percentage of population with self-care disability does not imply a direct cause-and-effect relationship. It remains uncertain whether the presence of Immigrants from Middle Africa influences an upward or downward trend in the level of percentage of population with self-care disability within an area, or if Immigrants from Middle Africa simply ended up residing in those areas with higher or lower levels of percentage of population with self-care disability due to other factors.

Demographics Similar to Immigrants from Middle Africa by Self-Care Disability

In terms of self-care disability, the demographic groups most similar to Immigrants from Middle Africa are Immigrants from Ireland (2.3%, a difference of 0.0%), Immigrants from Kenya (2.3%, a difference of 0.010%), Immigrants from China (2.3%, a difference of 0.080%), Immigrants from Netherlands (2.3%, a difference of 0.090%), and Immigrants from Switzerland (2.3%, a difference of 0.13%).
DemographicsRating | RankSelf-Care Disability
Immigrants from Northern Europe
99.2
/100
|
#70
Exceptional
2.3%
Asians
99.2
/100
|
#71
Exceptional
2.3%
Eastern Europeans
99.2
/100
|
#72
Exceptional
2.3%
Immigrants from Egypt
99.1
/100
|
#73
Exceptional
2.3%
Immigrants from Switzerland
99.1
/100
|
#74
Exceptional
2.3%
Immigrants from Netherlands
99.1
/100
|
#75
Exceptional
2.3%
Immigrants from China
99.1
/100
|
#76
Exceptional
2.3%
Immigrants from Middle Africa
99.0
/100
|
#77
Exceptional
2.3%
Immigrants from Ireland
99.0
/100
|
#78
Exceptional
2.3%
Immigrants from Kenya
99.0
/100
|
#79
Exceptional
2.3%
Chileans
98.8
/100
|
#80
Exceptional
2.3%
Ugandans
98.8
/100
|
#81
Exceptional
2.3%
Immigrants from Denmark
98.8
/100
|
#82
Exceptional
2.3%
Indians (Asian)
98.7
/100
|
#83
Exceptional
2.3%
Immigrants from Spain
98.7
/100
|
#84
Exceptional
2.3%

Immigrants from Middle Africa Self-Care Disability Correlation Summary

MeasurementImmigrants from Middle Africa DataSelf-Care Disability Data
Minimum0.047%0.061%
Maximum14.5%6.9%
Range14.5%6.8%
Mean3.7%2.4%
Median2.9%2.3%
Interquartile 25% (IQ1)1.4%1.9%
Interquartile 75% (IQ3)4.7%2.6%
Interquartile Range (IQR)3.3%0.73%
Standard Deviation (Sample)3.3%1.1%
Standard Deviation (Population)3.3%1.1%

Correlation Details

Immigrants from Middle Africa PercentileSample SizeSelf-Care Disability
[
0.0%
-
0.5%
]
0.047%
132,025,2512.5%
[
0.0%
-
0.5%
]
0.19%
33,278,4062.4%
[
0.0%
-
0.5%
]
0.32%
15,059,7192.4%
[
0.0%
-
0.5%
]
0.43%
7,452,7942.2%
[
0.5%
-
1.0%
]
0.57%
4,568,9272.3%
[
0.5%
-
1.0%
]
0.70%
2,671,2852.2%
[
0.5%
-
1.0%
]
0.83%
1,572,3642.2%
[
0.5%
-
1.0%
]
0.96%
957,7112.2%
[
1.0%
-
1.5%
]
1.08%
945,2292.2%
[
1.0%
-
1.5%
]
1.21%
887,3612.3%
[
1.0%
-
1.5%
]
1.34%
621,2042.1%
[
1.0%
-
1.5%
]
1.45%
279,7332.8%
[
1.5%
-
2.0%
]
1.62%
227,6052.5%
[
1.5%
-
2.0%
]
1.73%
294,6662.6%
[
1.5%
-
2.0%
]
1.86%
293,8911.9%
[
1.5%
-
2.0%
]
1.98%
178,6501.8%
[
2.0%
-
2.5%
]
2.14%
122,3112.2%
[
2.0%
-
2.5%
]
2.23%
153,2872.3%
[
2.0%
-
2.5%
]
2.37%
199,5531.8%
[
2.0%
-
2.5%
]
2.50%
127,0332.0%
[
2.5%
-
3.0%
]
2.60%
12,3653.3%
[
2.5%
-
3.0%
]
2.77%
9,4862.5%
[
2.5%
-
3.0%
]
2.90%
105,6071.7%
[
3.0%
-
3.5%
]
3.02%
49,8562.2%
[
3.0%
-
3.5%
]
3.17%
20,1741.8%
[
3.0%
-
3.5%
]
3.21%
3,6481.4%
[
3.0%
-
3.5%
]
3.40%
43,5542.6%
[
3.5%
-
4.0%
]
3.54%
125,9053.0%
[
3.5%
-
4.0%
]
3.69%
2,3304.3%
[
3.5%
-
4.0%
]
3.79%
12,1283.5%
[
4.0%
-
4.5%
]
4.17%
69,6342.3%
[
4.0%
-
4.5%
]
4.27%
76,3572.3%
[
4.0%
-
4.5%
]
4.46%
28,4271.9%
[
4.5%
-
5.0%
]
4.71%
17,6342.5%
[
4.5%
-
5.0%
]
4.75%
27,9091.9%
[
4.5%
-
5.0%
]
4.89%
26,6841.4%
[
5.5%
-
6.0%
]
5.66%
21,9851.3%
[
6.5%
-
7.0%
]
6.67%
2,6992.9%
[
7.5%
-
8.0%
]
7.84%
13,5801.1%
[
8.5%
-
9.0%
]
8.63%
1,0086.9%
[
8.5%
-
9.0%
]
8.92%
3,1043.5%
[
8.5%
-
9.0%
]
8.99%
15,4893.6%
[
10.5%
-
11.0%
]
10.96%
4,8090.51%
[
11.0%
-
11.5%
]
11.47%
1,9970.061%
[
14.5%
-
15.0%
]
14.52%
1,2404.9%