Immigrants from Liberia 1 or more Vehicles in Household
COMPARE
Immigrants from Liberia
Select to Compare
1 or more Vehicles in Household
Immigrants from Liberia 1 or more Vehicles in Household
87.8%
1+ VEHICLES AVAILABLE
0.4/ 100
METRIC RATING
264th/ 347
METRIC RANK
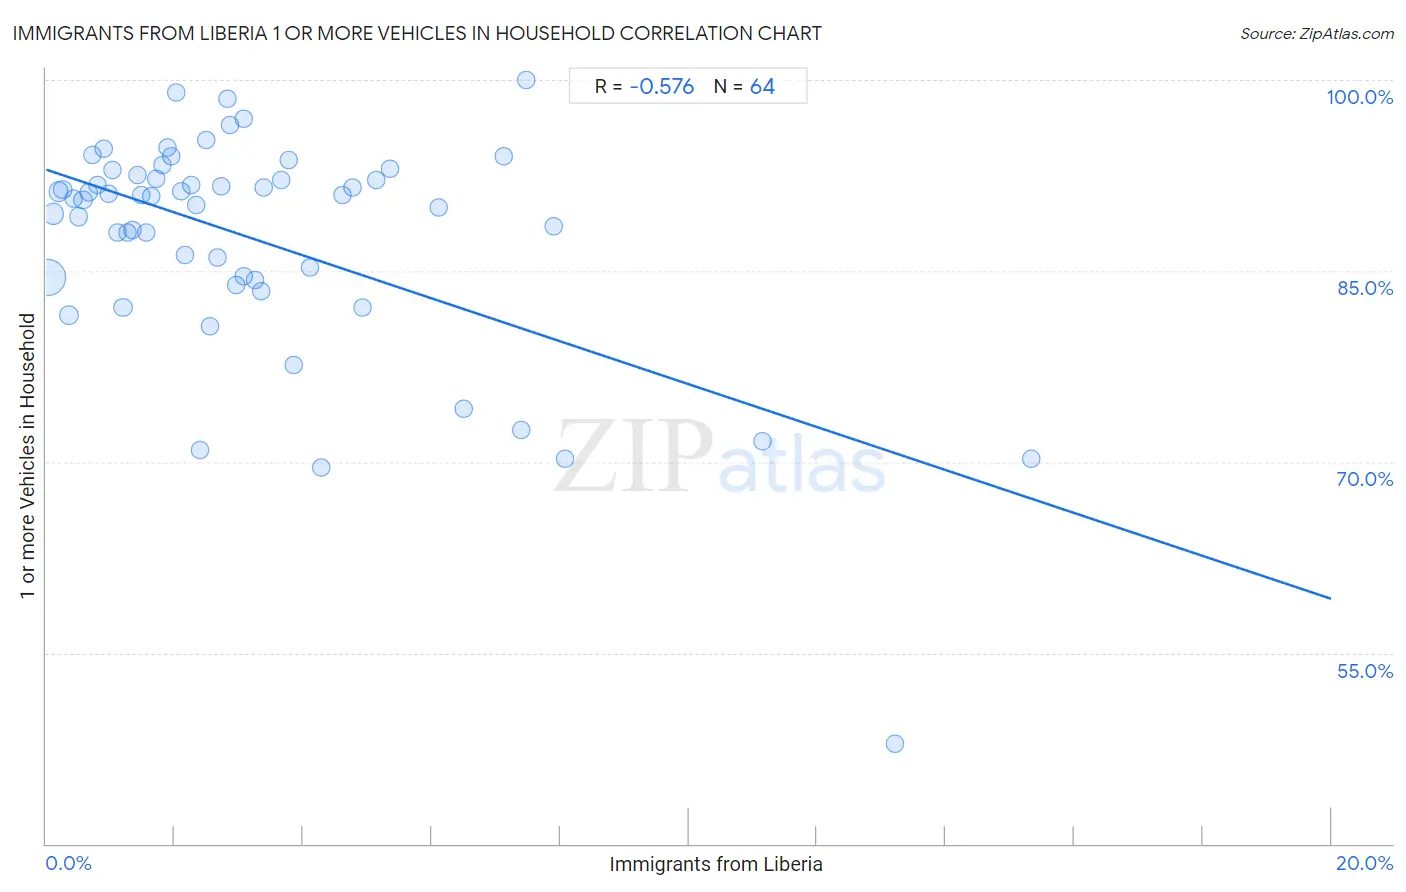
Immigrants from Liberia 1 or more Vehicles in Household Correlation Chart
The statistical analysis conducted on geographies consisting of 135,251,590 people shows a substantial negative correlation between the proportion of Immigrants from Liberia and percentage of households with 1 or more vehicles available in the United States with a correlation coefficient (R) of -0.576 and weighted average of 87.8%. On average, for every 1% (one percent) increase in Immigrants from Liberia within a typical geography, there is a decrease of 1.7% in percentage of households with 1 or more vehicles available.
It is essential to understand that the correlation between the percentage of Immigrants from Liberia and percentage of households with 1 or more vehicles available does not imply a direct cause-and-effect relationship. It remains uncertain whether the presence of Immigrants from Liberia influences an upward or downward trend in the level of percentage of households with 1 or more vehicles available within an area, or if Immigrants from Liberia simply ended up residing in those areas with higher or lower levels of percentage of households with 1 or more vehicles available due to other factors.
Demographics Similar to Immigrants from Liberia by 1 or more Vehicles in Household
In terms of 1 or more vehicles in household, the demographic groups most similar to Immigrants from Liberia are Immigrants from Egypt (87.8%, a difference of 0.010%), African (87.8%, a difference of 0.020%), Subsaharan African (87.9%, a difference of 0.080%), Immigrants from Switzerland (87.9%, a difference of 0.11%), and Macedonian (87.9%, a difference of 0.15%).
| Demographics | Rating | Rank | 1 or more Vehicles in Household |
| Liberians | 0.9 /100 | #257 | Tragic 88.0% |
| South American Indians | 0.9 /100 | #258 | Tragic 88.0% |
| Nigerians | 0.8 /100 | #259 | Tragic 88.0% |
| Macedonians | 0.6 /100 | #260 | Tragic 87.9% |
| Immigrants from Switzerland | 0.6 /100 | #261 | Tragic 87.9% |
| Sub-Saharan Africans | 0.5 /100 | #262 | Tragic 87.9% |
| Immigrants from Egypt | 0.5 /100 | #263 | Tragic 87.8% |
| Immigrants from Liberia | 0.4 /100 | #264 | Tragic 87.8% |
| Africans | 0.4 /100 | #265 | Tragic 87.8% |
| Israelis | 0.3 /100 | #266 | Tragic 87.7% |
| Immigrants from Colombia | 0.3 /100 | #267 | Tragic 87.6% |
| Immigrants from Europe | 0.2 /100 | #268 | Tragic 87.6% |
| Immigrants from Africa | 0.2 /100 | #269 | Tragic 87.6% |
| Panamanians | 0.2 /100 | #270 | Tragic 87.5% |
| Bermudans | 0.2 /100 | #271 | Tragic 87.5% |
Immigrants from Liberia 1 or more Vehicles in Household Correlation Summary
| Measurement | Immigrants from Liberia Data | 1 or more Vehicles in Household Data |
| Minimum | 0.028% | 47.9% |
| Maximum | 15.3% | 100.0% |
| Range | 15.3% | 52.1% |
| Mean | 3.3% | 87.5% |
| Median | 2.4% | 90.7% |
| Interquartile 25% (IQ1) | 1.2% | 84.4% |
| Interquartile 75% (IQ3) | 4.2% | 92.3% |
| Interquartile Range (IQR) | 3.0% | 8.0% |
| Standard Deviation (Sample) | 3.1% | 9.0% |
| Standard Deviation (Population) | 3.0% | 8.9% |
Correlation Details
| Immigrants from Liberia Percentile | Sample Size | 1 or more Vehicles in Household |
[ 0.0% - 0.5% ] 0.028% | 92,525,065 | 84.5% |
[ 0.0% - 0.5% ] 0.11% | 16,917,850 | 89.5% |
[ 0.0% - 0.5% ] 0.19% | 8,253,340 | 91.2% |
[ 0.0% - 0.5% ] 0.26% | 4,346,148 | 91.4% |
[ 0.0% - 0.5% ] 0.35% | 4,457,993 | 81.5% |
[ 0.0% - 0.5% ] 0.42% | 1,573,372 | 90.7% |
[ 0.0% - 0.5% ] 0.50% | 1,689,387 | 89.3% |
[ 0.5% - 1.0% ] 0.57% | 910,570 | 90.6% |
[ 0.5% - 1.0% ] 0.66% | 503,893 | 91.1% |
[ 0.5% - 1.0% ] 0.73% | 375,660 | 94.1% |
[ 0.5% - 1.0% ] 0.80% | 335,805 | 91.8% |
[ 0.5% - 1.0% ] 0.89% | 181,982 | 94.6% |
[ 0.5% - 1.0% ] 0.96% | 448,826 | 91.1% |
[ 1.0% - 1.5% ] 1.03% | 347,729 | 92.9% |
[ 1.0% - 1.5% ] 1.11% | 103,306 | 88.0% |
[ 1.0% - 1.5% ] 1.20% | 518,373 | 82.1% |
[ 1.0% - 1.5% ] 1.26% | 89,285 | 88.1% |
[ 1.0% - 1.5% ] 1.34% | 107,193 | 88.2% |
[ 1.0% - 1.5% ] 1.42% | 121,884 | 92.5% |
[ 1.0% - 1.5% ] 1.48% | 8,705 | 91.0% |
[ 1.5% - 2.0% ] 1.57% | 21,905 | 88.0% |
[ 1.5% - 2.0% ] 1.64% | 113,593 | 90.8% |
[ 1.5% - 2.0% ] 1.72% | 176,668 | 92.2% |
[ 1.5% - 2.0% ] 1.81% | 42,534 | 93.3% |
[ 1.5% - 2.0% ] 1.89% | 56,572 | 94.7% |
[ 1.5% - 2.0% ] 1.94% | 23,101 | 94.0% |
[ 2.0% - 2.5% ] 2.03% | 9,507 | 99.0% |
[ 2.0% - 2.5% ] 2.10% | 52,655 | 91.3% |
[ 2.0% - 2.5% ] 2.17% | 47,729 | 86.3% |
[ 2.0% - 2.5% ] 2.25% | 33,620 | 91.7% |
[ 2.0% - 2.5% ] 2.34% | 95,009 | 90.2% |
[ 2.0% - 2.5% ] 2.40% | 91,692 | 71.0% |
[ 2.0% - 2.5% ] 2.49% | 6,295 | 95.3% |
[ 2.5% - 3.0% ] 2.55% | 50,464 | 80.7% |
[ 2.5% - 3.0% ] 2.67% | 12,017 | 86.1% |
[ 2.5% - 3.0% ] 2.73% | 13,811 | 91.6% |
[ 2.5% - 3.0% ] 2.83% | 5,234 | 98.5% |
[ 2.5% - 3.0% ] 2.87% | 35,244 | 96.5% |
[ 2.5% - 3.0% ] 2.95% | 1,730 | 83.9% |
[ 3.0% - 3.5% ] 3.07% | 17,716 | 97.0% |
[ 3.0% - 3.5% ] 3.08% | 15,709 | 84.6% |
[ 3.0% - 3.5% ] 3.25% | 30,544 | 84.3% |
[ 3.0% - 3.5% ] 3.34% | 8,596 | 83.4% |
[ 3.0% - 3.5% ] 3.39% | 48,577 | 91.5% |
[ 3.5% - 4.0% ] 3.66% | 23,363 | 92.1% |
[ 3.5% - 4.0% ] 3.78% | 32,912 | 93.7% |
[ 3.5% - 4.0% ] 3.86% | 1,425 | 77.6% |
[ 4.0% - 4.5% ] 4.10% | 11,051 | 85.3% |
[ 4.0% - 4.5% ] 4.27% | 14,550 | 69.5% |
[ 4.5% - 5.0% ] 4.60% | 22,337 | 91.0% |
[ 4.5% - 5.0% ] 4.76% | 21,620 | 91.6% |
[ 4.5% - 5.0% ] 4.93% | 23,804 | 82.2% |
[ 5.0% - 5.5% ] 5.14% | 84,951 | 92.2% |
[ 5.0% - 5.5% ] 5.35% | 37,169 | 93.0% |
[ 6.0% - 6.5% ] 6.12% | 32,967 | 90.0% |
[ 6.0% - 6.5% ] 6.49% | 22,493 | 74.2% |
[ 7.0% - 7.5% ] 7.11% | 13,075 | 94.0% |
[ 7.0% - 7.5% ] 7.38% | 35,780 | 72.5% |
[ 7.0% - 7.5% ] 7.48% | 468 | 100.0% |
[ 7.5% - 8.0% ] 7.91% | 28,392 | 88.5% |
[ 8.0% - 8.5% ] 8.07% | 10,682 | 70.3% |
[ 11.0% - 11.5% ] 11.15% | 3,156 | 71.6% |
[ 13.0% - 13.5% ] 13.21% | 1,658 | 47.9% |
[ 15.0% - 15.5% ] 15.34% | 2,849 | 70.3% |