Immigrants from Liberia Self-Care Disability
COMPARE
Immigrants from Liberia
Select to Compare
Self-Care Disability
Immigrants from Liberia Self-Care Disability
2.6%
SELF-CARE DISABILITY
0.4/ 100
METRIC RATING
251st/ 347
METRIC RANK
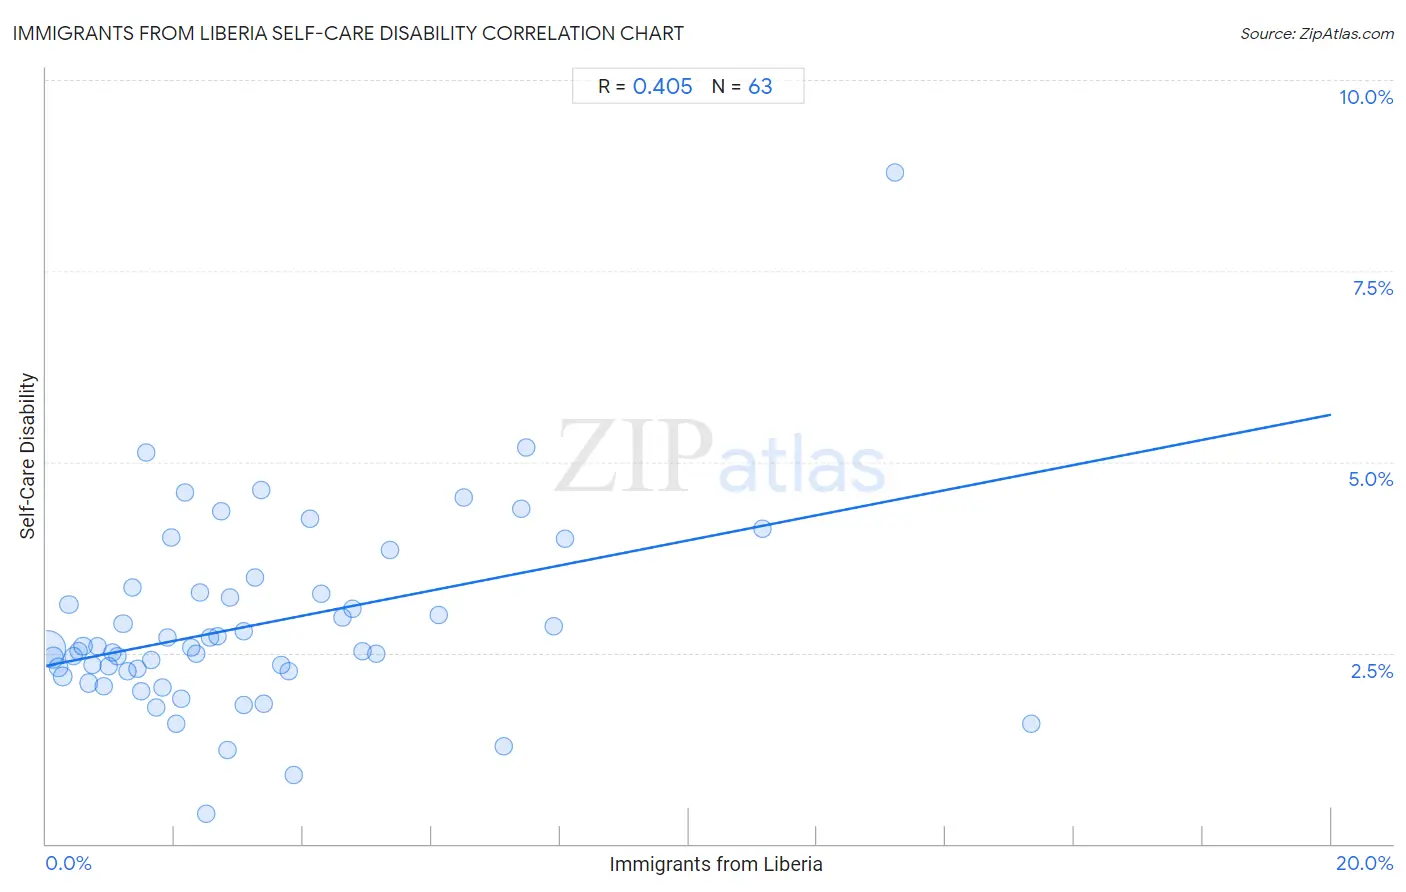
Immigrants from Liberia Self-Care Disability Correlation Chart
The statistical analysis conducted on geographies consisting of 135,176,274 people shows a moderate positive correlation between the proportion of Immigrants from Liberia and percentage of population with self-care disability in the United States with a correlation coefficient (R) of 0.405 and weighted average of 2.6%. On average, for every 1% (one percent) increase in Immigrants from Liberia within a typical geography, there is an increase of 0.16% in percentage of population with self-care disability.
It is essential to understand that the correlation between the percentage of Immigrants from Liberia and percentage of population with self-care disability does not imply a direct cause-and-effect relationship. It remains uncertain whether the presence of Immigrants from Liberia influences an upward or downward trend in the level of percentage of population with self-care disability within an area, or if Immigrants from Liberia simply ended up residing in those areas with higher or lower levels of percentage of population with self-care disability due to other factors.
Demographics Similar to Immigrants from Liberia by Self-Care Disability
In terms of self-care disability, the demographic groups most similar to Immigrants from Liberia are Immigrants from Bangladesh (2.6%, a difference of 0.070%), Portuguese (2.6%, a difference of 0.080%), Immigrants from Haiti (2.6%, a difference of 0.15%), Mexican American Indian (2.6%, a difference of 0.16%), and Haitian (2.6%, a difference of 0.17%).
| Demographics | Rating | Rank | Self-Care Disability |
| Yuman | 0.8 /100 | #244 | Tragic 2.6% |
| Immigrants from Western Asia | 0.6 /100 | #245 | Tragic 2.6% |
| Cheyenne | 0.6 /100 | #246 | Tragic 2.6% |
| Immigrants from Albania | 0.6 /100 | #247 | Tragic 2.6% |
| Nicaraguans | 0.6 /100 | #248 | Tragic 2.6% |
| Mexican American Indians | 0.5 /100 | #249 | Tragic 2.6% |
| Portuguese | 0.4 /100 | #250 | Tragic 2.6% |
| Immigrants from Liberia | 0.4 /100 | #251 | Tragic 2.6% |
| Immigrants from Bangladesh | 0.4 /100 | #252 | Tragic 2.6% |
| Immigrants from Haiti | 0.3 /100 | #253 | Tragic 2.6% |
| Haitians | 0.3 /100 | #254 | Tragic 2.6% |
| Tsimshian | 0.3 /100 | #255 | Tragic 2.6% |
| Immigrants from Central America | 0.3 /100 | #256 | Tragic 2.6% |
| Potawatomi | 0.3 /100 | #257 | Tragic 2.6% |
| Nonimmigrants | 0.3 /100 | #258 | Tragic 2.6% |
Immigrants from Liberia Self-Care Disability Correlation Summary
| Measurement | Immigrants from Liberia Data | Self-Care Disability Data |
| Minimum | 0.028% | 0.40% |
| Maximum | 15.3% | 8.8% |
| Range | 15.3% | 8.4% |
| Mean | 3.3% | 2.9% |
| Median | 2.4% | 2.6% |
| Interquartile 25% (IQ1) | 1.2% | 2.3% |
| Interquartile 75% (IQ3) | 4.3% | 3.3% |
| Interquartile Range (IQR) | 3.1% | 1.0% |
| Standard Deviation (Sample) | 3.1% | 1.3% |
| Standard Deviation (Population) | 3.1% | 1.2% |
Correlation Details
| Immigrants from Liberia Percentile | Sample Size | Self-Care Disability |
[ 0.0% - 0.5% ] 0.028% | 92,515,466 | 2.6% |
[ 0.0% - 0.5% ] 0.11% | 16,908,248 | 2.4% |
[ 0.0% - 0.5% ] 0.19% | 8,253,340 | 2.3% |
[ 0.0% - 0.5% ] 0.26% | 4,336,547 | 2.2% |
[ 0.0% - 0.5% ] 0.35% | 4,457,993 | 3.1% |
[ 0.0% - 0.5% ] 0.42% | 1,560,861 | 2.5% |
[ 0.0% - 0.5% ] 0.50% | 1,669,090 | 2.5% |
[ 0.5% - 1.0% ] 0.57% | 910,570 | 2.6% |
[ 0.5% - 1.0% ] 0.66% | 503,893 | 2.1% |
[ 0.5% - 1.0% ] 0.73% | 375,660 | 2.3% |
[ 0.5% - 1.0% ] 0.80% | 332,810 | 2.6% |
[ 0.5% - 1.0% ] 0.89% | 176,012 | 2.1% |
[ 0.5% - 1.0% ] 0.96% | 446,405 | 2.3% |
[ 1.0% - 1.5% ] 1.03% | 347,729 | 2.5% |
[ 1.0% - 1.5% ] 1.11% | 103,306 | 2.5% |
[ 1.0% - 1.5% ] 1.20% | 518,373 | 2.9% |
[ 1.0% - 1.5% ] 1.26% | 89,285 | 2.3% |
[ 1.0% - 1.5% ] 1.34% | 107,193 | 3.4% |
[ 1.0% - 1.5% ] 1.42% | 121,884 | 2.3% |
[ 1.0% - 1.5% ] 1.48% | 8,705 | 2.0% |
[ 1.5% - 2.0% ] 1.57% | 21,592 | 5.1% |
[ 1.5% - 2.0% ] 1.64% | 113,593 | 2.4% |
[ 1.5% - 2.0% ] 1.72% | 176,668 | 1.8% |
[ 1.5% - 2.0% ] 1.81% | 42,257 | 2.1% |
[ 1.5% - 2.0% ] 1.89% | 56,572 | 2.7% |
[ 1.5% - 2.0% ] 1.94% | 23,101 | 4.0% |
[ 2.0% - 2.5% ] 2.03% | 9,507 | 1.6% |
[ 2.0% - 2.5% ] 2.10% | 52,655 | 1.9% |
[ 2.0% - 2.5% ] 2.17% | 47,729 | 4.6% |
[ 2.0% - 2.5% ] 2.25% | 33,620 | 2.6% |
[ 2.0% - 2.5% ] 2.34% | 95,009 | 2.5% |
[ 2.0% - 2.5% ] 2.40% | 91,692 | 3.3% |
[ 2.0% - 2.5% ] 2.49% | 6,295 | 0.40% |
[ 2.5% - 3.0% ] 2.55% | 50,464 | 2.7% |
[ 2.5% - 3.0% ] 2.67% | 12,017 | 2.7% |
[ 2.5% - 3.0% ] 2.73% | 13,811 | 4.3% |
[ 2.5% - 3.0% ] 2.83% | 5,234 | 1.2% |
[ 2.5% - 3.0% ] 2.87% | 35,244 | 3.2% |
[ 3.0% - 3.5% ] 3.07% | 17,716 | 1.8% |
[ 3.0% - 3.5% ] 3.08% | 15,709 | 2.8% |
[ 3.0% - 3.5% ] 3.25% | 30,544 | 3.5% |
[ 3.0% - 3.5% ] 3.34% | 8,596 | 4.6% |
[ 3.0% - 3.5% ] 3.39% | 48,577 | 1.8% |
[ 3.5% - 4.0% ] 3.66% | 23,363 | 2.3% |
[ 3.5% - 4.0% ] 3.78% | 32,912 | 2.3% |
[ 3.5% - 4.0% ] 3.86% | 1,425 | 0.89% |
[ 4.0% - 4.5% ] 4.10% | 11,051 | 4.2% |
[ 4.0% - 4.5% ] 4.27% | 14,550 | 3.3% |
[ 4.5% - 5.0% ] 4.60% | 22,337 | 3.0% |
[ 4.5% - 5.0% ] 4.76% | 21,620 | 3.1% |
[ 4.5% - 5.0% ] 4.93% | 23,804 | 2.5% |
[ 5.0% - 5.5% ] 5.14% | 84,951 | 2.5% |
[ 5.0% - 5.5% ] 5.35% | 37,169 | 3.8% |
[ 6.0% - 6.5% ] 6.12% | 32,967 | 3.0% |
[ 6.0% - 6.5% ] 6.49% | 22,493 | 4.5% |
[ 7.0% - 7.5% ] 7.11% | 13,075 | 1.3% |
[ 7.0% - 7.5% ] 7.38% | 35,780 | 4.4% |
[ 7.0% - 7.5% ] 7.48% | 468 | 5.2% |
[ 7.5% - 8.0% ] 7.91% | 28,392 | 2.8% |
[ 8.0% - 8.5% ] 8.07% | 10,682 | 4.0% |
[ 11.0% - 11.5% ] 11.15% | 3,156 | 4.1% |
[ 13.0% - 13.5% ] 13.21% | 1,658 | 8.8% |
[ 15.0% - 15.5% ] 15.34% | 2,849 | 1.6% |