Immigrants from Liberia Married-couple Households
COMPARE
Immigrants from Liberia
Select to Compare
Married-couple Households
Immigrants from Liberia Married-couple Households
40.3%
MARRIED-COUPLE HOUSEHOLDS
0.0/ 100
METRIC RATING
321st/ 347
METRIC RANK
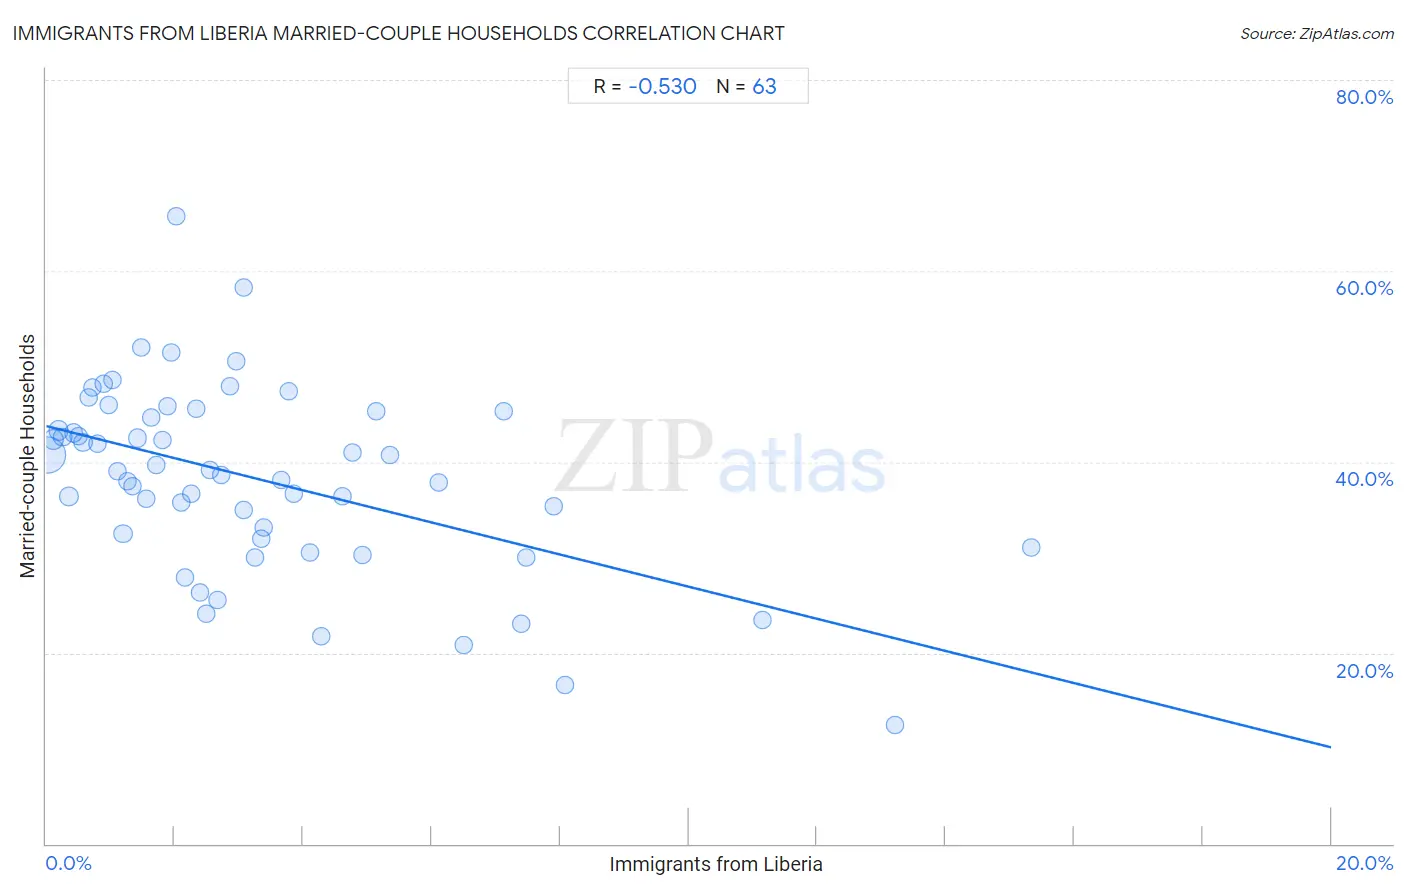
Immigrants from Liberia Married-couple Households Correlation Chart
The statistical analysis conducted on geographies consisting of 135,232,319 people shows a substantial negative correlation between the proportion of Immigrants from Liberia and percentage of married-couple family households in the United States with a correlation coefficient (R) of -0.530 and weighted average of 40.3%. On average, for every 1% (one percent) increase in Immigrants from Liberia within a typical geography, there is a decrease of 1.7% in percentage of married-couple family households.
It is essential to understand that the correlation between the percentage of Immigrants from Liberia and percentage of married-couple family households does not imply a direct cause-and-effect relationship. It remains uncertain whether the presence of Immigrants from Liberia influences an upward or downward trend in the level of percentage of married-couple family households within an area, or if Immigrants from Liberia simply ended up residing in those areas with higher or lower levels of percentage of married-couple family households due to other factors.
Demographics Similar to Immigrants from Liberia by Married-couple Households
In terms of married-couple households, the demographic groups most similar to Immigrants from Liberia are West Indian (40.3%, a difference of 0.040%), Bahamian (40.5%, a difference of 0.45%), Immigrants from Zaire (40.1%, a difference of 0.66%), Puerto Rican (40.1%, a difference of 0.66%), and Navajo (40.1%, a difference of 0.67%).
| Demographics | Rating | Rank | Married-couple Households |
| Jamaicans | 0.0 /100 | #314 | Tragic 40.9% |
| Trinidadians and Tobagonians | 0.0 /100 | #315 | Tragic 40.9% |
| Immigrants from Caribbean | 0.0 /100 | #316 | Tragic 40.8% |
| Immigrants from Jamaica | 0.0 /100 | #317 | Tragic 40.7% |
| Liberians | 0.0 /100 | #318 | Tragic 40.7% |
| Bahamians | 0.0 /100 | #319 | Tragic 40.5% |
| West Indians | 0.0 /100 | #320 | Tragic 40.3% |
| Immigrants from Liberia | 0.0 /100 | #321 | Tragic 40.3% |
| Immigrants from Zaire | 0.0 /100 | #322 | Tragic 40.1% |
| Puerto Ricans | 0.0 /100 | #323 | Tragic 40.1% |
| Navajo | 0.0 /100 | #324 | Tragic 40.1% |
| Pueblo | 0.0 /100 | #325 | Tragic 40.0% |
| U.S. Virgin Islanders | 0.0 /100 | #326 | Tragic 39.8% |
| Lumbee | 0.0 /100 | #327 | Tragic 39.6% |
| Barbadians | 0.0 /100 | #328 | Tragic 39.4% |
Immigrants from Liberia Married-couple Households Correlation Summary
| Measurement | Immigrants from Liberia Data | Married-couple Households Data |
| Minimum | 0.028% | 12.5% |
| Maximum | 15.3% | 65.7% |
| Range | 15.3% | 53.2% |
| Mean | 3.3% | 38.2% |
| Median | 2.4% | 39.0% |
| Interquartile 25% (IQ1) | 1.2% | 32.0% |
| Interquartile 75% (IQ3) | 4.3% | 45.3% |
| Interquartile Range (IQR) | 3.1% | 13.3% |
| Standard Deviation (Sample) | 3.1% | 9.8% |
| Standard Deviation (Population) | 3.1% | 9.7% |
Correlation Details
| Immigrants from Liberia Percentile | Sample Size | Married-couple Households |
[ 0.0% - 0.5% ] 0.028% | 92,519,164 | 40.7% |
[ 0.0% - 0.5% ] 0.11% | 16,912,077 | 42.3% |
[ 0.0% - 0.5% ] 0.19% | 8,253,340 | 43.3% |
[ 0.0% - 0.5% ] 0.26% | 4,346,148 | 42.6% |
[ 0.0% - 0.5% ] 0.35% | 4,457,993 | 36.4% |
[ 0.0% - 0.5% ] 0.42% | 1,573,372 | 43.0% |
[ 0.0% - 0.5% ] 0.50% | 1,687,024 | 42.7% |
[ 0.5% - 1.0% ] 0.57% | 910,570 | 42.0% |
[ 0.5% - 1.0% ] 0.66% | 503,893 | 46.7% |
[ 0.5% - 1.0% ] 0.73% | 375,660 | 47.8% |
[ 0.5% - 1.0% ] 0.80% | 335,805 | 41.9% |
[ 0.5% - 1.0% ] 0.89% | 181,982 | 48.2% |
[ 0.5% - 1.0% ] 0.96% | 448,826 | 45.9% |
[ 1.0% - 1.5% ] 1.03% | 347,729 | 48.6% |
[ 1.0% - 1.5% ] 1.11% | 103,306 | 39.0% |
[ 1.0% - 1.5% ] 1.20% | 518,373 | 32.5% |
[ 1.0% - 1.5% ] 1.26% | 89,285 | 38.0% |
[ 1.0% - 1.5% ] 1.34% | 107,193 | 37.5% |
[ 1.0% - 1.5% ] 1.42% | 121,884 | 42.5% |
[ 1.0% - 1.5% ] 1.48% | 8,705 | 51.9% |
[ 1.5% - 2.0% ] 1.57% | 21,905 | 36.2% |
[ 1.5% - 2.0% ] 1.64% | 113,593 | 44.6% |
[ 1.5% - 2.0% ] 1.72% | 176,668 | 39.7% |
[ 1.5% - 2.0% ] 1.81% | 42,534 | 42.3% |
[ 1.5% - 2.0% ] 1.89% | 56,572 | 45.9% |
[ 1.5% - 2.0% ] 1.94% | 23,101 | 51.5% |
[ 2.0% - 2.5% ] 2.03% | 9,507 | 65.7% |
[ 2.0% - 2.5% ] 2.10% | 52,655 | 35.8% |
[ 2.0% - 2.5% ] 2.17% | 47,729 | 27.9% |
[ 2.0% - 2.5% ] 2.25% | 33,620 | 36.6% |
[ 2.0% - 2.5% ] 2.34% | 95,009 | 45.6% |
[ 2.0% - 2.5% ] 2.40% | 91,692 | 26.4% |
[ 2.0% - 2.5% ] 2.49% | 6,295 | 24.2% |
[ 2.5% - 3.0% ] 2.55% | 50,464 | 39.1% |
[ 2.5% - 3.0% ] 2.67% | 12,017 | 25.5% |
[ 2.5% - 3.0% ] 2.73% | 13,811 | 38.6% |
[ 2.5% - 3.0% ] 2.87% | 35,244 | 47.9% |
[ 2.5% - 3.0% ] 2.95% | 1,730 | 50.6% |
[ 3.0% - 3.5% ] 3.07% | 17,716 | 58.2% |
[ 3.0% - 3.5% ] 3.08% | 15,709 | 34.9% |
[ 3.0% - 3.5% ] 3.25% | 30,544 | 30.0% |
[ 3.0% - 3.5% ] 3.34% | 8,596 | 32.0% |
[ 3.0% - 3.5% ] 3.39% | 48,577 | 33.1% |
[ 3.5% - 4.0% ] 3.66% | 23,363 | 38.1% |
[ 3.5% - 4.0% ] 3.78% | 32,912 | 47.5% |
[ 3.5% - 4.0% ] 3.86% | 1,425 | 36.6% |
[ 4.0% - 4.5% ] 4.10% | 11,051 | 30.5% |
[ 4.0% - 4.5% ] 4.27% | 14,550 | 21.7% |
[ 4.5% - 5.0% ] 4.60% | 22,337 | 36.3% |
[ 4.5% - 5.0% ] 4.76% | 21,620 | 41.0% |
[ 4.5% - 5.0% ] 4.93% | 23,804 | 30.2% |
[ 5.0% - 5.5% ] 5.14% | 84,951 | 45.3% |
[ 5.0% - 5.5% ] 5.35% | 37,169 | 40.8% |
[ 6.0% - 6.5% ] 6.12% | 32,967 | 37.8% |
[ 6.0% - 6.5% ] 6.49% | 22,493 | 20.8% |
[ 7.0% - 7.5% ] 7.11% | 13,075 | 45.3% |
[ 7.0% - 7.5% ] 7.38% | 35,780 | 23.0% |
[ 7.0% - 7.5% ] 7.48% | 468 | 30.0% |
[ 7.5% - 8.0% ] 7.91% | 28,392 | 35.4% |
[ 8.0% - 8.5% ] 8.07% | 10,682 | 16.6% |
[ 11.0% - 11.5% ] 11.15% | 3,156 | 23.4% |
[ 13.0% - 13.5% ] 13.21% | 1,658 | 12.5% |
[ 15.0% - 15.5% ] 15.34% | 2,849 | 31.1% |