Immigrants from Liberia Married-Couple Family Poverty
COMPARE
Immigrants from Liberia
Select to Compare
Married-Couple Family Poverty
Immigrants from Liberia Married-Couple Family Poverty
5.5%
POVERTY | MARRIED-COUPLE FAMILIES
13.3/ 100
METRIC RATING
213th/ 347
METRIC RANK
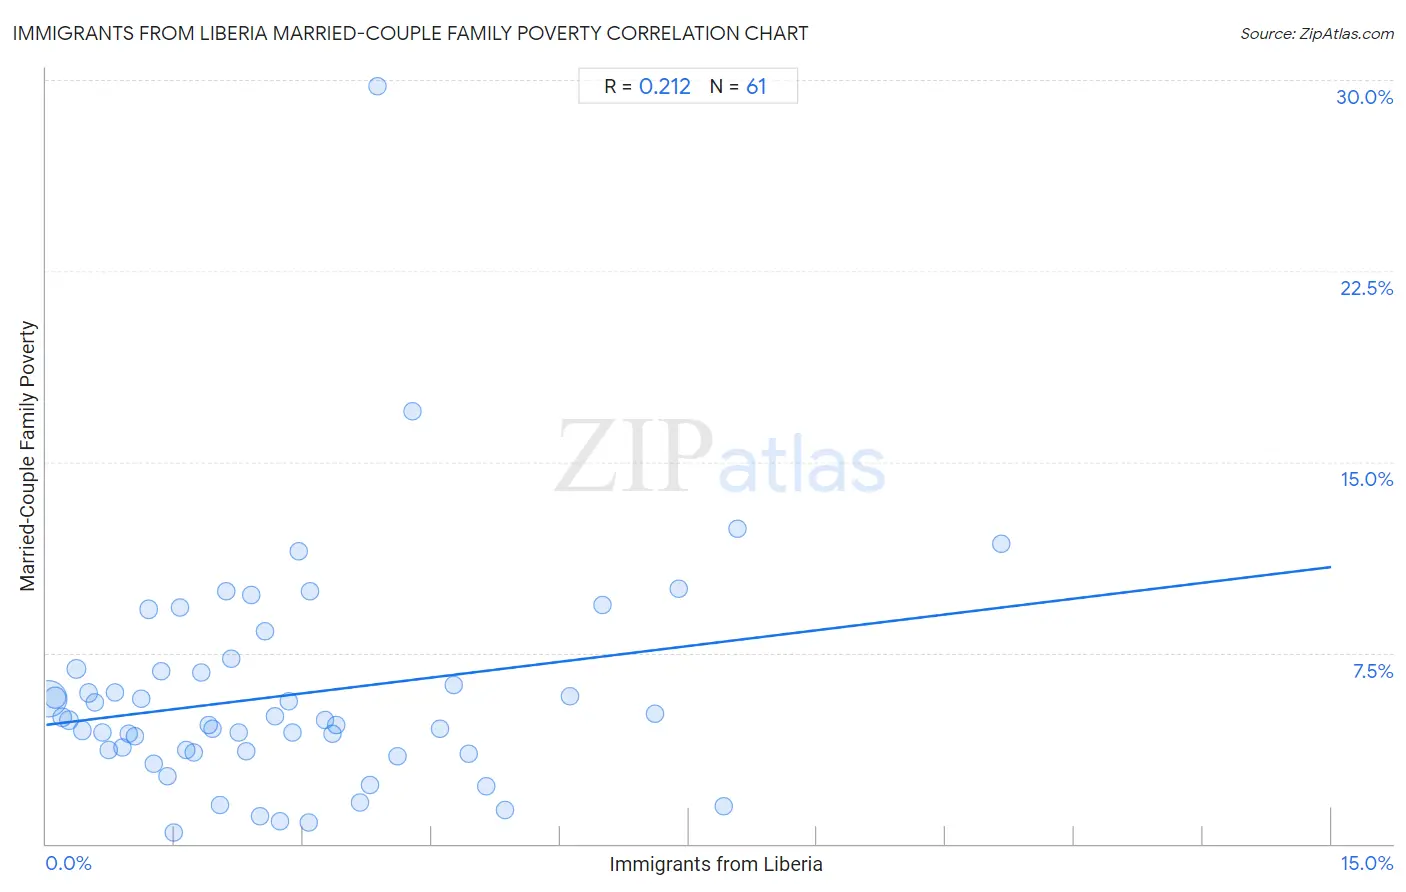
Immigrants from Liberia Married-Couple Family Poverty Correlation Chart
The statistical analysis conducted on geographies consisting of 134,804,518 people shows a weak positive correlation between the proportion of Immigrants from Liberia and poverty level among married-couple families in the United States with a correlation coefficient (R) of 0.212 and weighted average of 5.5%. On average, for every 1% (one percent) increase in Immigrants from Liberia within a typical geography, there is an increase of 0.41% in poverty level among married-couple families.
It is essential to understand that the correlation between the percentage of Immigrants from Liberia and poverty level among married-couple families does not imply a direct cause-and-effect relationship. It remains uncertain whether the presence of Immigrants from Liberia influences an upward or downward trend in the level of poverty level among married-couple families within an area, or if Immigrants from Liberia simply ended up residing in those areas with higher or lower levels of poverty level among married-couple families due to other factors.
Demographics Similar to Immigrants from Liberia by Married-Couple Family Poverty
In terms of married-couple family poverty, the demographic groups most similar to Immigrants from Liberia are Iroquois (5.5%, a difference of 0.040%), Armenian (5.5%, a difference of 0.11%), Immigrants from Thailand (5.5%, a difference of 0.18%), Potawatomi (5.5%, a difference of 0.23%), and Nigerian (5.5%, a difference of 0.25%).
| Demographics | Rating | Rank | Married-Couple Family Poverty |
| Osage | 18.4 /100 | #206 | Poor 5.4% |
| Immigrants from Africa | 17.6 /100 | #207 | Poor 5.5% |
| French American Indians | 16.1 /100 | #208 | Poor 5.5% |
| Immigrants from Syria | 15.4 /100 | #209 | Poor 5.5% |
| Immigrants from Micronesia | 14.4 /100 | #210 | Poor 5.5% |
| Nigerians | 14.3 /100 | #211 | Poor 5.5% |
| Immigrants from Thailand | 14.0 /100 | #212 | Poor 5.5% |
| Immigrants from Liberia | 13.3 /100 | #213 | Poor 5.5% |
| Iroquois | 13.1 /100 | #214 | Poor 5.5% |
| Armenians | 12.8 /100 | #215 | Poor 5.5% |
| Potawatomi | 12.4 /100 | #216 | Poor 5.5% |
| Immigrants from Nigeria | 11.3 /100 | #217 | Poor 5.5% |
| Afghans | 11.2 /100 | #218 | Poor 5.5% |
| Japanese | 9.8 /100 | #219 | Tragic 5.6% |
| Colombians | 9.2 /100 | #220 | Tragic 5.6% |
Immigrants from Liberia Married-Couple Family Poverty Correlation Summary
| Measurement | Immigrants from Liberia Data | Married-Couple Family Poverty Data |
| Minimum | 0.028% | 0.42% |
| Maximum | 11.2% | 29.8% |
| Range | 11.1% | 29.4% |
| Mean | 2.8% | 5.8% |
| Median | 2.3% | 4.9% |
| Interquartile 25% (IQ1) | 1.2% | 3.6% |
| Interquartile 75% (IQ3) | 3.8% | 6.8% |
| Interquartile Range (IQR) | 2.7% | 3.2% |
| Standard Deviation (Sample) | 2.3% | 4.5% |
| Standard Deviation (Population) | 2.3% | 4.4% |
Correlation Details
| Immigrants from Liberia Percentile | Sample Size | Married-Couple Family Poverty |
[ 0.0% - 0.5% ] 0.028% | 92,426,776 | 5.7% |
[ 0.0% - 0.5% ] 0.11% | 16,808,073 | 5.7% |
[ 0.0% - 0.5% ] 0.19% | 8,212,059 | 5.0% |
[ 0.0% - 0.5% ] 0.26% | 4,282,145 | 4.9% |
[ 0.0% - 0.5% ] 0.35% | 4,448,254 | 6.9% |
[ 0.0% - 0.5% ] 0.42% | 1,555,647 | 4.4% |
[ 0.0% - 0.5% ] 0.50% | 1,676,729 | 5.9% |
[ 0.5% - 1.0% ] 0.57% | 891,169 | 5.5% |
[ 0.5% - 1.0% ] 0.66% | 496,121 | 4.4% |
[ 0.5% - 1.0% ] 0.73% | 374,961 | 3.7% |
[ 0.5% - 1.0% ] 0.80% | 333,171 | 5.9% |
[ 0.5% - 1.0% ] 0.89% | 178,852 | 3.8% |
[ 0.5% - 1.0% ] 0.97% | 411,674 | 4.3% |
[ 1.0% - 1.5% ] 1.03% | 347,729 | 4.2% |
[ 1.0% - 1.5% ] 1.11% | 103,306 | 5.7% |
[ 1.0% - 1.5% ] 1.20% | 515,770 | 9.2% |
[ 1.0% - 1.5% ] 1.26% | 89,285 | 3.1% |
[ 1.0% - 1.5% ] 1.34% | 107,193 | 6.8% |
[ 1.0% - 1.5% ] 1.42% | 113,122 | 2.7% |
[ 1.0% - 1.5% ] 1.48% | 8,705 | 0.42% |
[ 1.5% - 2.0% ] 1.56% | 19,665 | 9.3% |
[ 1.5% - 2.0% ] 1.64% | 112,973 | 3.7% |
[ 1.5% - 2.0% ] 1.72% | 176,668 | 3.6% |
[ 1.5% - 2.0% ] 1.81% | 42,257 | 6.7% |
[ 1.5% - 2.0% ] 1.89% | 56,572 | 4.7% |
[ 1.5% - 2.0% ] 1.94% | 23,101 | 4.5% |
[ 2.0% - 2.5% ] 2.03% | 9,507 | 1.5% |
[ 2.0% - 2.5% ] 2.09% | 49,320 | 9.9% |
[ 2.0% - 2.5% ] 2.17% | 47,729 | 7.3% |
[ 2.0% - 2.5% ] 2.25% | 33,620 | 4.4% |
[ 2.0% - 2.5% ] 2.34% | 95,009 | 3.6% |
[ 2.0% - 2.5% ] 2.40% | 91,692 | 9.8% |
[ 2.0% - 2.5% ] 2.49% | 6,295 | 1.1% |
[ 2.5% - 3.0% ] 2.55% | 50,464 | 8.3% |
[ 2.5% - 3.0% ] 2.67% | 12,017 | 5.0% |
[ 2.5% - 3.0% ] 2.73% | 13,811 | 0.90% |
[ 2.5% - 3.0% ] 2.83% | 5,234 | 5.6% |
[ 2.5% - 3.0% ] 2.87% | 35,244 | 4.4% |
[ 2.5% - 3.0% ] 2.95% | 1,730 | 11.5% |
[ 3.0% - 3.5% ] 3.07% | 17,716 | 0.85% |
[ 3.0% - 3.5% ] 3.08% | 15,709 | 9.9% |
[ 3.0% - 3.5% ] 3.25% | 30,544 | 4.9% |
[ 3.0% - 3.5% ] 3.34% | 8,596 | 4.3% |
[ 3.0% - 3.5% ] 3.39% | 48,577 | 4.7% |
[ 3.5% - 4.0% ] 3.66% | 23,363 | 1.6% |
[ 3.5% - 4.0% ] 3.78% | 32,912 | 2.3% |
[ 3.5% - 4.0% ] 3.86% | 1,425 | 29.8% |
[ 4.0% - 4.5% ] 4.10% | 11,051 | 3.4% |
[ 4.0% - 4.5% ] 4.27% | 14,550 | 17.0% |
[ 4.5% - 5.0% ] 4.60% | 22,337 | 4.5% |
[ 4.5% - 5.0% ] 4.76% | 21,620 | 6.2% |
[ 4.5% - 5.0% ] 4.93% | 23,804 | 3.5% |
[ 5.0% - 5.5% ] 5.14% | 84,951 | 2.2% |
[ 5.0% - 5.5% ] 5.35% | 37,169 | 1.3% |
[ 6.0% - 6.5% ] 6.12% | 32,967 | 5.8% |
[ 6.0% - 6.5% ] 6.49% | 22,493 | 9.4% |
[ 7.0% - 7.5% ] 7.11% | 13,075 | 5.1% |
[ 7.0% - 7.5% ] 7.38% | 35,780 | 10.0% |
[ 7.5% - 8.0% ] 7.91% | 28,392 | 1.5% |
[ 8.0% - 8.5% ] 8.07% | 10,682 | 12.4% |
[ 11.0% - 11.5% ] 11.15% | 3,156 | 11.8% |